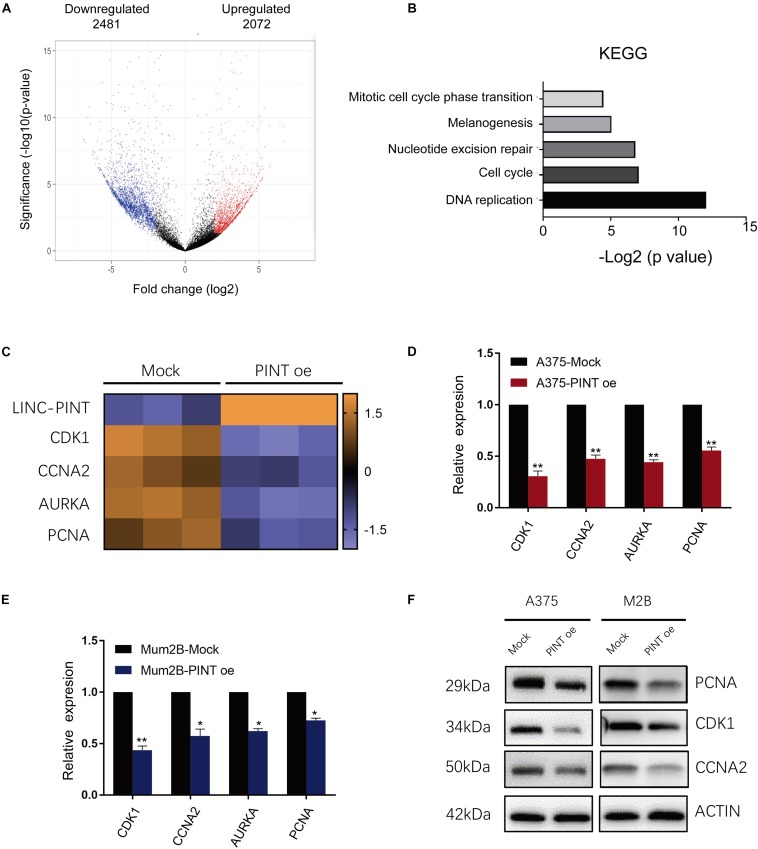
FIGURE 5.
The target genes of LINC-PINT were identified in melanoma cells. (A) Volcano plots of differentially expressed gene. The X axis represented log fold changes. The Y axis represented log p-values. The red points denoted the significantly upregulated genes and blue points denoted the significantly downregulated genes. (B) KEGG analysis of differentially expressed genes between Mock and PINT oe A375 cells. (C) Heat map showed the differentially expressed genes related to cell cycle progression. (D,E) The downregulated cell cycle genes in the microarray were verified in A375 and Mum2B cells by real-time PCR. ∗p < 0.05, ∗∗p < 0.01. (F) The expression of LINC-PINT target genes was detected by western blot. Actin were used as internal controls.

