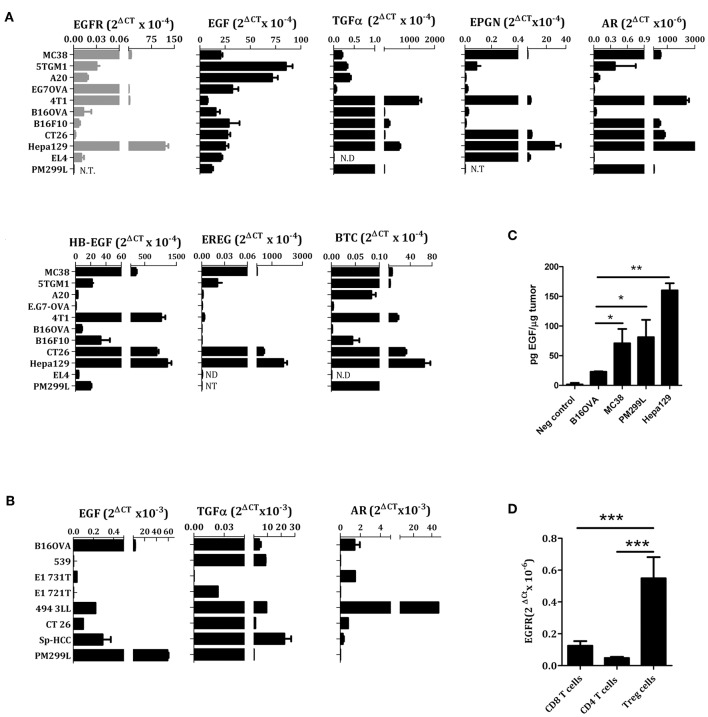
Figure 1.
EGFR ligands and EGFR expression in different cell lines (A), tumor biopsies (B,C), and lymphocytes (D) analyzed by RT PCR. EL4, lymphoma; Hepa129 and PM299L, hepatocellular carcinoma; CT26, colon carcinoma; B16F10 and B16-OVA, melanoma; 4T1, breast cancer; EG7OVA, lymphoma; A20, reticulum cell sarcoma; 5TGM1, myeloma; MC38, colon carcinoma. (C) Amount of EGF in tumor cell extracts measured by ELISA, (D) EGFR expression in resting T cells. *p < 0.05; **p < 0.01; ***p < 0.005.

