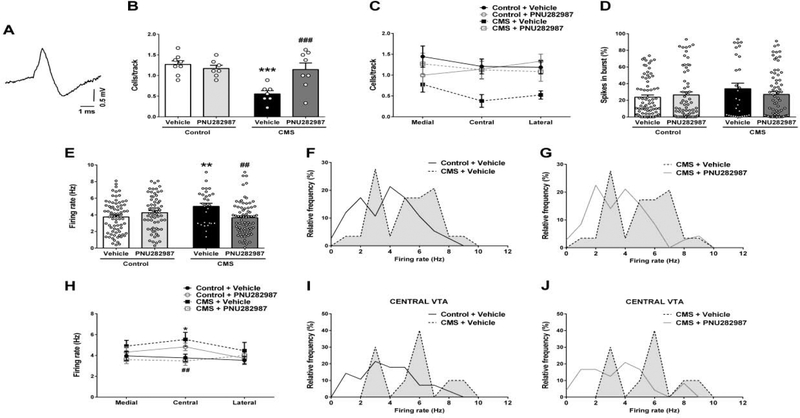
Fig. 3. α7 nAChR full agonist PNU282987 (1 mg/kg i.v.) reversed the stress-induced decrease in dopaminergic neurotransmission.
(A) Representative trace of in vivo recorded DA neuron in the VTA. (B) Number of spontaneously active DA neurons recorded per electrode track in VTA (n = 7–8 rats/group). (C) Regional distribution across the VTA of the number of active DA neurons per electrode track (n = 7–8 rats/group). (D) Mean percentage of spikes in bursts and (E) firing rate (Hz) of the recorded DA neurons (n = 29–75 cells/group). Firing rate distribution curves showing (F) the effect of stress and (G) its reversal by PNU282987. Kolmogorov-Smirnov test, control+vehicle vs. CMS+vehicle: p=0.022; CMS+vehicle vs. CMS+PNU282987: p=0.004. (H) Regional distribution across the VTA of average DA neurons firing rate (medial: n = 13–29 cells/group; central: n = 10–28 cells/group; lateral: n = 06–24 cells/group). Firing rate distribution curves showing (I) the effect of stress and (J) its reversal by PNU282987. Kolmogorov-Smirnov test, control+vehicle vs. CMS+vehicle: p=0.092; CMS+vehicle vs. CMS+PNU282987: p=0.066. Data are expressed as mean ± S.E.M. Bonferroni post-hoc test: *p<0.05, **p<0.01, ***p<0.001 comparing with control+vehicle, ##p<0.01, ###p<0.001 comparing with CMS+vehicle.

