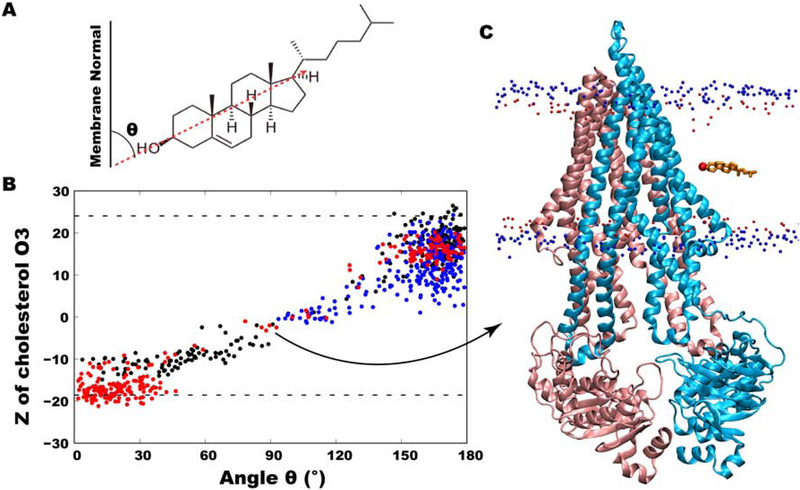
Figure 6:
Cholesterol orientation in the membrane, defined as the angle between the long axis of cholesterol and membrane normal. (A) A schematic showing the vector used in measuring the angle. (B) z-coordinates of the hydroxyl group O3 atom of cholesterol molecules involved in complete or partial flipping as a function of their angles with respect to membrane normal. The completely flipped cholesterol molecule is shown in red dots. (C) Molecular representation of Pgp shown in cartoon representation (blue and pink colors) with the completely flipped cholesterol molecule present at its 90 degree angle during flipping. Phosphorus atoms of POPC and O3 atoms of other cholesterol molecules are shown in small blue and red spheres in the background.

