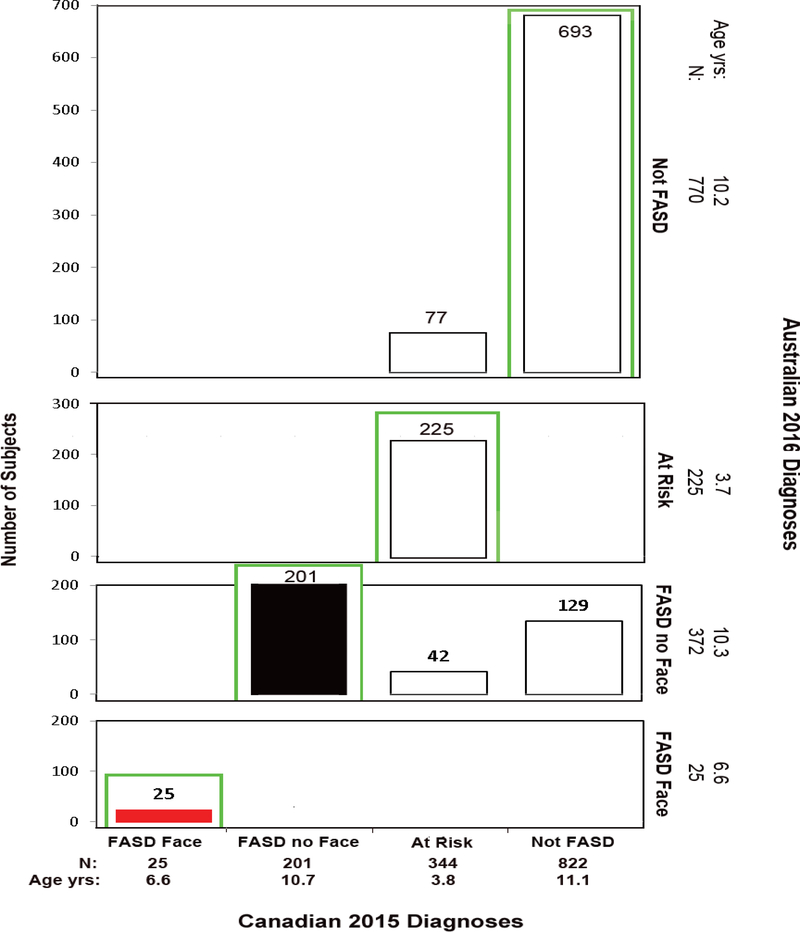
Figure 10.
Cross-tabulation of the Canadian 2015 and Australian 2016 FASD Diagnostic Outcomes. Diagnostic concordance (green boxes) between the Canadian 2015 and Australian 2016 systems was observed in 82% (1,144/1,392) of the patients with the majority of the concordance due to 693 of the patients receiving a “Not FASD” diagnosis by both systems. This higher level of concordance is due to the fact that the Australian system adopted most of the criteria used by the Canadian system, with one important exception. The Canadian system requires confirmed high PAE. The Australian system requires confirmed PAE at any level. Red bars reflect “FASD with and without the Face” diagnoses using the Canadian system. As a demonstration for how to interpret this figure; 822 patients received a Canadian classification of “Not FASD”. Of the 822 patients, 129 received an “FASD without the Face” and 693 received a “Not FASD” classification using the Australian diagnostic system. The 129 diagnosed “FASD with no Face” by the Australian system all had confirmed PAE, but the level did not meet the Canadian requirement for high exposure. Red bars reflect “FAS with the Face” diagnoses using the Canadian system. Black bars reflect “FASD without the Face” diagnoses using the Canadian system. Abbreviations: Age yrs; mean age in years at diagnosis.

