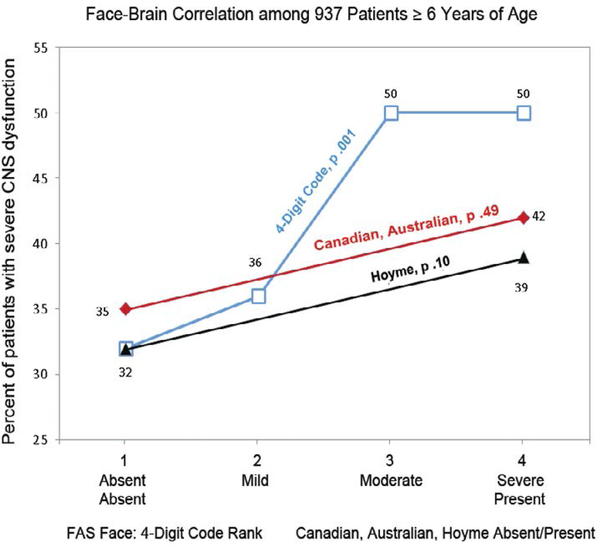
Figure 15.
Significant Correlation Between Face and Brain Lost when the Facial Phenotype is Reduced to Present/Absent. The FAS facial phenotype presents along a clinically meaningful continuum. A significant correlation between the magnitude of expression of the FAS facial phenotype and the prevalence of severe CNS dysfunction (CNS Rank 3) is identified when the facial phenotype is recorded on the 4-point ordinal scale used by the 4-Digit Code (blue line: Chi2 linear trend=10.5, p=0.001). Linear trends serve as one of the most powerful metrics for identifying causal associations. When the magnitude of expression of the FAS facial phenotype is collapsed into just two categories (present, absent), as introduced by the Hoyme, Canadian and Australian systems, the significant correlation between face and brain is lost. Not only does a dichotomous scale have less statistical power to identify real associations, but where the ordinal scale is bisected impacts the validity of the dichotomous scale. It is clear from the pattern of association depicted by the blue line that the prevalence of CNS dysfunction associated with the Rank 1 and 2 faces (32% and 36%) are distinct from the prevalence of dysfunction associated with the Rank 3 and 4 faces (50% and 50%) The most clinically valid cut-point to bisect the ordinal scale would be between Ranks 2 and 3. The Canadian and Australian systems used a cut-point between Ranks 3 and 4 to dichotomize the FAS facial phenotype (Present=Rank 4; Absent=Ranks 1, 2 and 3). The Hoyme system used a cut-point halfway through Rank 1 to dichotomize the face (Present=Ranks 2, 3, 4 and half of Rank 1; Absent=the other half of Rank 1) (Figure 3B). Both dichotomous scales (red and black lines) failed to identify the significant correlation that exists between the severity of the FAS facial phenotype and prevalence of severe brain dysfunction (Canadian and Australian: Chi2=0.5, p=0.46; Hoyme: Chi2=4.7, p =0.10).

