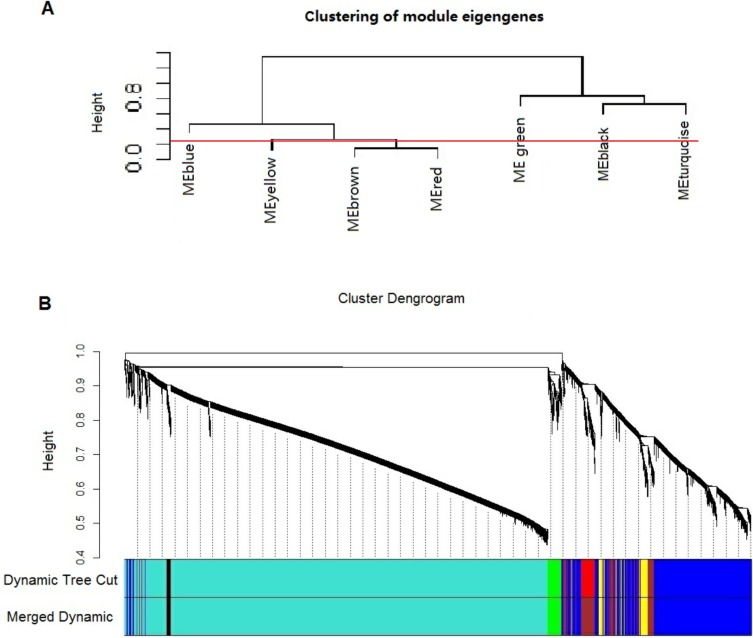
Figure 2.
Construction of co-expression modules using WGCNA. (A) Cluster dendrogram of module eigengenes. (B) Dendrograms of differentially expressed genes clustered based on dissimilarity measures (1-TOM). Each short vertical line represents one gene, and the area of each color signifies the number size of each cluster of co-expression modules.

