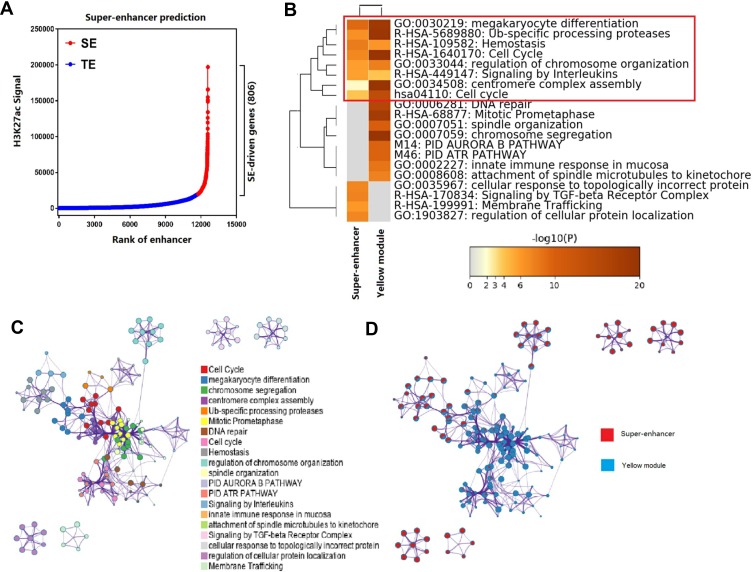
Figure 4.
Pathways and functional annotations for SE-associated genes and eigengenes in the yellow module. (A) Prediction of SEs and SE-associated genes. SEs were predicted using the ROSE algorithm, and SE-associated genes were located closest to their respective SEs. A dot plot of the rank of enhancers based on the H3K27ac ChIP-seq signal was generated. In total, 806 SEs and SE-associated genes were predicted (red dots). Blue dots represent typical enhancers (TE). (B) Heat map showing top enrichment clusters for SE-associated genes and eigengenes, one row per cluster, with a discrete color scale representing statistical significance (-Log P). Gray color indicates lack of significance. (C) Metascape enrichment network visualization showing intra-cluster and inter-cluster similarities of enriched terms for SE-associated genes and eigengenes in the yellow module. Each term is represented by a circle node, where its size is proportional to the number of input genes falling into that term, and its color represents cluster identity. Terms with a similarity score > 0.3 are linked by an edge (the thickness of the edge represents the similarity score). One term from each cluster was selected to have its description shown as a label. (D) Enrichment network visualization of results from SE-associated genes and eigengenes in the yellow module, whereby nodes are represented by pie charts indicating association with each input study.

