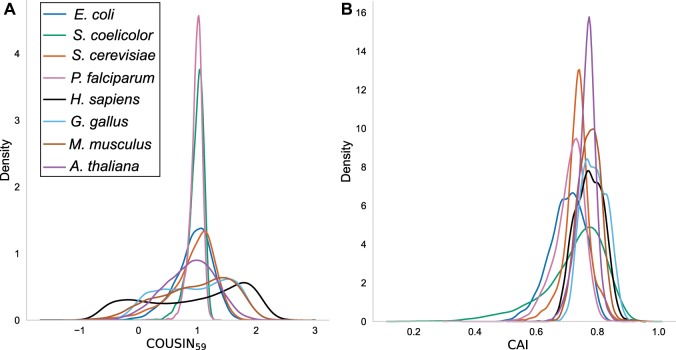
Fig. 2.
—Density curves for (A) and CAI (B) indices for the complete CDSs of the eight organisms studied (see color legend). For each CDS the values for and CAI were calculated against the average codon usage reference table of the corresponding genome. The normalization renders curves centered around 1 allowing for rapid identification of differential dispersion in the leptokurtic curves for organisms with strong nucleotide compositional biases (e.g., Streptomyces coelicolor, in green) compared with those more platykurtic for organisms with weaker compositional biases (e.g., Escherichia coli in blue). Notice the bimodal distributions for Homo sapiens (black) and Gallus gallus (light blue) in panel A.

