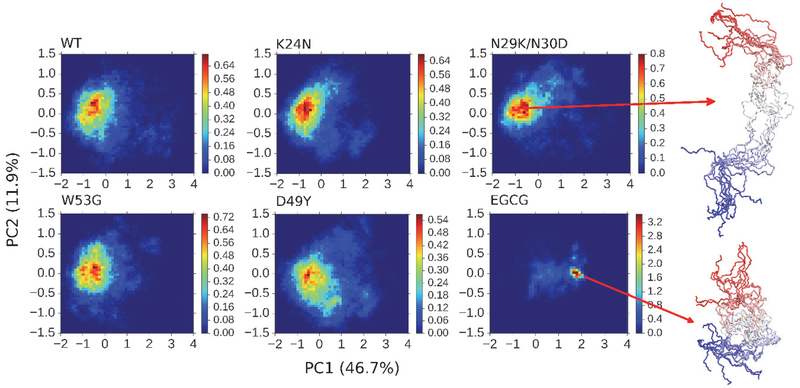
Figure 5.
Projection of simulated structural ensembles of p53-TAD onto the first two principal components. The heat maps indicate probability distributions derived from simulation statistics. Values in the parenthesis are percentages of variance in each direction. Ten representative snapshots are shown for each of the two selected states, with the color changing from red at the N-terminus to blue at the C-terminus.

