Figure 2.
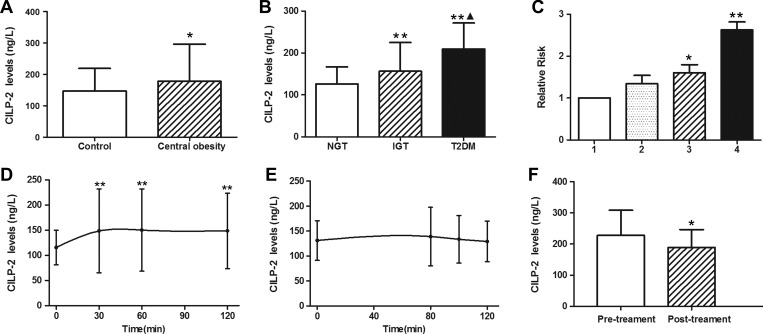
Circulating CILP-2 levels in study population. (A) Circulating CILP-2 levels according to waist circumference (WC, central obesity: male ≥ 94 cm; female ≥ 80 cm). (B) Circulating CILP-2 levels in NGT, IGT, and T2DM. (C) Prevalence of elevated T2DM in different quartiles of CILP-2 (Quartile 1, <119.4 ng/L; Quartile 2, 119.4–136.7 ng/L; Quartile 3, 136.7–165.2 ng/L; Quartile 4, >165.2 ng/L). (D) Circulating CILP-2 levels in healthy subjects during OGTT. (E) Circulating CILP-2 levels in healthy subjects during EHC. (F) Circulating CILP-2 levels in T2DM patients treated with Exenatide. *P < 0.05, **P < 0.01 vs. controls, NGT, Quartile 1, 0 min, or pretreatment. NGT, normal controls; IGT, impaired glucose tolerance; T2DM, type 2 diabetes mellitus. ▴P < 0.05 vs. IGT. Data are expressed as mean ± SD.

