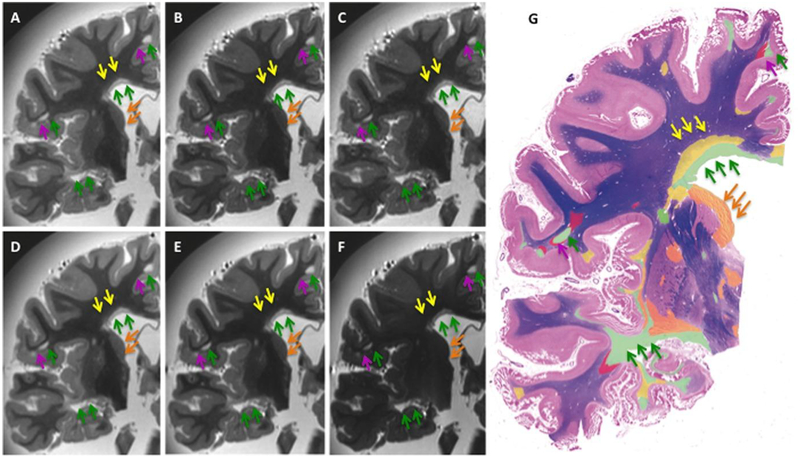
Fig 5.
Imaging/histopathology comparisons. Side-by-side LFB staining, T2-w GRASE and T2-w TSE images exhibiting the best SI and CNR in each group of 3 representative samples. In the figure, (A) T2-w GRASE sequence EPI/TE = 3/50 ms, (B) T2-w GRASE sequence EPI/TE = 3/75 ms, (C) T2-w GRASE sequence EPI/TE = 7/75 ms, (D) T2-w TSE sequence TE = 35 ms, (E) T2-w TSE sequence TE = 45 ms, (F) T2-w TSE sequence TE = 75 ms, (G) color-coded LFB staining indicating in green areas of complete WM demyelination, in yellow areas of WM remyelination, in red areas of WM Wallerian degeneration with secondary demyelination, and in orange areas of deep GM demyelination.

