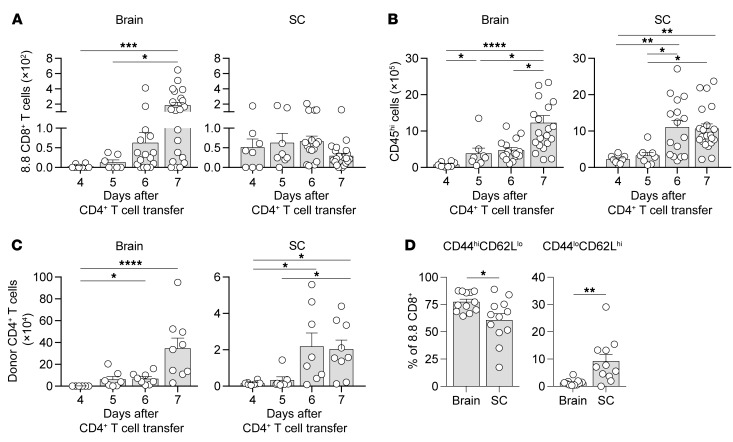
Figure 2. 8.8 CD8+ T cells accumulate and acquire a more activated phenotype in the brain compared with spinal cord.
(A–C) EAE was induced by transfer of CD45.1.2+ MOG-specific CD4+ T cells into CD45.1.1+ mice that had received CD45.2.2+ 8.8 CD8+ T cells 1 day earlier. The numbers of 8.8 CD8+ T cells (A), CD45hi inflammatory cells (B), and donor CD4+ T cells (C) were determined for the brain and spinal cord (SC) by flow cytometry on the indicated days after CD4+ T cell transfer (n ≥ 8 for each day). (D) EAE was induced by transfer of CD45.1.1+ MOG-specific CD4+ T cells into CD45.2.2+ WT or 8.8 intact mice (n = 12). Mononuclear cells were isolated from the brain and spinal cord 7 days after CD4+ T cell transfer and analyzed by flow cytometry. The percentage of activated (CD44hiCD62Llo) and naive (CD44loCD62Lhi) 8.8 CD8+ T cells is shown. Gating strategies are shown in Supplemental Figure 2. Graphs show mean + SEM (1 symbol per mouse) and are compiled from at least 2 independent experiments. Statistical significance was determined using Kruskal-Wallis with Dunn’s post-test (A–C) or Mann-Whitney U test (D). *P < 0.05, **P < 0.01, ***P < 0.001, ****P < 0.0001.

