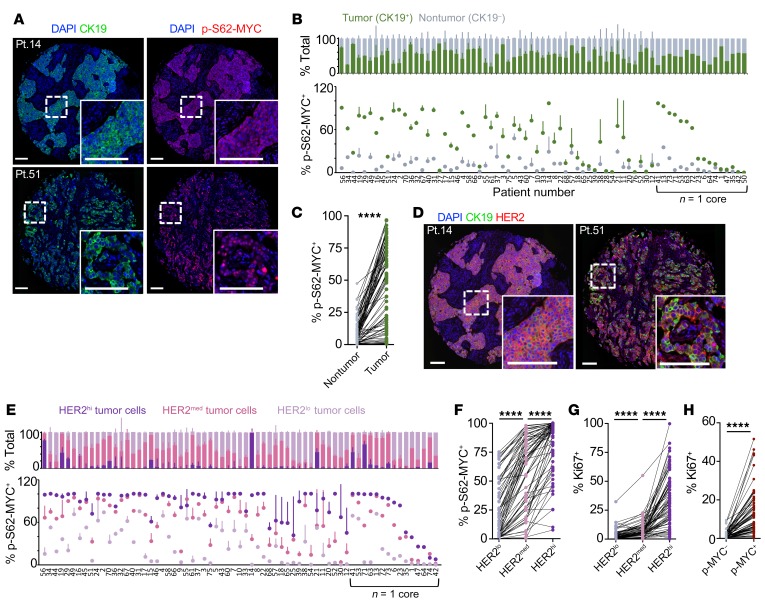
Figure 2. MYC phosphorylation is elevated in HER2+ patient tumors and correlated with HER2 expression.
(A) Immunofluorescence images of 2 human HER2+ breast tumors from a TMA of 75 HER2+ patients with local disease showing CK19 (green) and p-S62-MYC (red) expression, with DAPI staining nuclei (blue); insets show higher magnification. Scale bars: 100 μm. (B) TMA tumor images were segmented for single cells and cells were classified as part of the tumor (CK19+) or nontumor stromal (CK19–) compartment. The frequency of p-S62-MYC positivity is compared between the compartments, with tumors arranged by the Z-score of frequency difference (n = 71 assessable cores). SDs calculated from comparing frequencies between patient-matched cores (patients with one sample are grouped to right, arranged by p-S62-MYC frequency in tumor cells). (C) A patient-paired vertical scatterplot showing p-S62-MYC+ cell frequency between the nontumor stroma and tumor compartments of patients (n = 71). (D) Immunofluorescence images showing expression of CK19 (green), HER2 (red), and DAPI staining (blue) in patient tumors from A. Scale bars: 100 μm. (E) The frequency of p-S62-MYC+ tumor cells is compared between the HER2hi, HER2med, and HER2lo fractions of each tumor containing at least 2% HER2hi/med tumor cells (n = 67). Tumors are arranged by the cumulative Z-score of p-S62-MYC frequency between HER2hi, HER2med, and HER2lo fractions. SDs shown between patient-matched cores (patients with one sample are grouped to right, arranged by the frequency of p-S62-MYC+ cells in the HER2hi fraction). (F) A patient-paired vertical scatterplot showing p-S62-MYC+ cell frequency between the HER2hi, HER2med, and HER2lo tumor cell fractions (n = 67). (G) The frequency of Ki-67+ cells is compared between HER2hi, HER2med, and HER2lo fractions as in F. (H) The frequency of Ki-67+ cells is shown between the p-S62-MYC–positive and –negative tumor fractions (n = 71). ****P < 0.001 by Wilcoxon’s matched-pairs signed-rank test, indicating significant differences in frequency between compartments (C and F–H).

