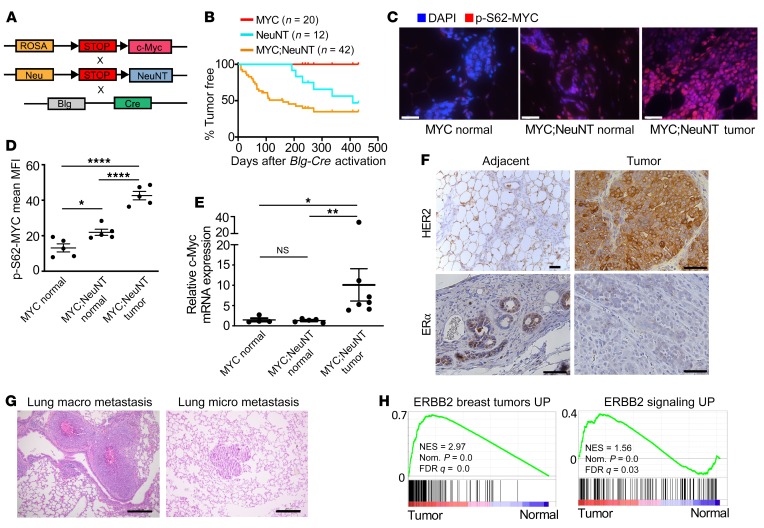
Figure 3. Deregulated MYC accelerates HER2 tumorigenesis in vivo.
(A) Schematic showing the mouse strains crossed to generate the MYC;NeuNT (Rosa-LSL-Myv;LSL-NeuNT;Blg-Cre) mice. (B) Mammary gland tumor incidence from MYC (Rosa-LSL-Myc;Blg-Cre), NeuNT (LSL-NeuNT;Blg-Cre), and MYC;NeuNT (Rosa-LSL-Myc;LSL-NeuNT;Blg-Cre) mice. (C) Immunofluorescence images of p-S62-MYC in normal mammary gland from the MYC and MYC;NeuNT mice; and mammary tumors from MYC;NeuNT mice. Scale bars: 50 μm. (D) Mean fluorescence intensity (MFI) of p-Ser62-MYC was measured in p-Ser62-MYC–positive cells and compared between each mouse strain shown in C (n = 5 normal mammary gland/tumors per mouse strain). Asterisks denote significant differences in MFI: *P < 0.05, ****P < 0.0001, 1-way ANOVA corrected for multiple comparisons. (E) qRT-PCR of Myc mRNA levels in MYC (n = 4) and MYC;NeuNT (n = 6) normal mammary glands, as well as MYC;NeuNT mammary tumors (n = 6). Asterisks denote significant differences in expression: *P < 0.05 and **P < 0.01, Kruskal-Wallis test corrected for multiple comparisons. NS, not significant. (F) Images of representative (n = 45) chromogenic IHC for HER2 and ERα in MYC;NeuNT mammary tumors and adjacent normal mammary gland. Scale bars: 50 μm. (G) Representative H&E staining of macro and micro lung metastasis in MYC;NeuNT mice (n = 40). Scale bars: 200 μm. (H) GSEA results examining gene sets related to human ERBB2 breast tumors (left) and ERBB signaling (right), comparing MYC;NeuNT tumors with normal mammary gland. See Supplemental data set 2 for full GSEA results. NES, normalized enrichment score.

