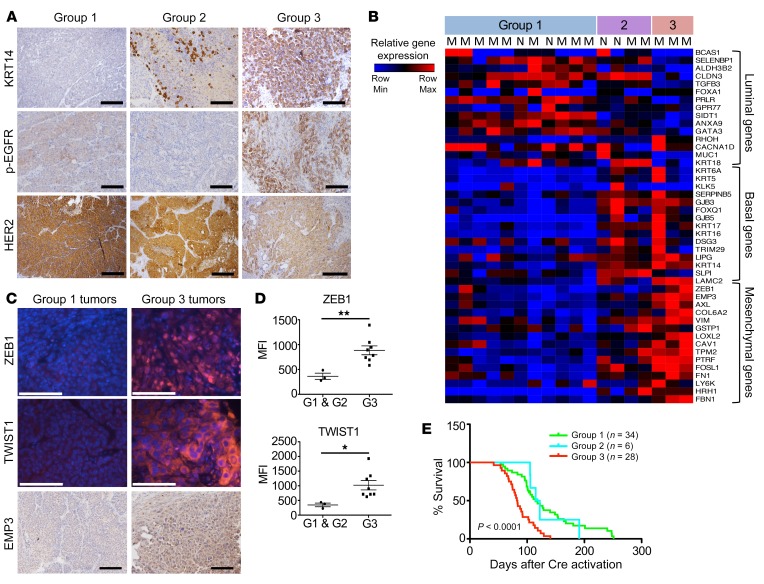
Figure 6. Group 3 MYC;NeuNT tumors are phenotypically and functionally distinct.
(A) Representative IHC images of cytokeratin 14 (KRT14), p-EGFR, and HER2 in the 3 different MYC;NeuNT tumor groups. Scale bars: 100 μm. See Table 2 for full data set summary. (B) A heatmap comparing expression of 45 lineage-correlated genes in tumors from the 3 groups, including 15 luminal genes, 15 basal/myoepithelial genes, and 15 mesenchymal genes. MYC;NeuNT tumors are marked with an “M”; NeuNT tumors with an “N.” (C) Representative immunofluorescence and IHC images showing ZEB1, TWIST1, and EMP3 in G1 (n = 3) and G3 (n = 8) tumors. Scale bars: 100 μm. (D) The average mean fluorescence intensity (MFI) for ZEB1 and TWIST1 expression in MYC;NeuNT G1 (n = 3) and G3 (n = 8) tumors. Asterisks denote significant differences in MFI: *P < 0.05, **P < 0.01, 2-tailed Student’s t test. (E) Kaplan-Meier plot comparing overall survival between the 3 groups of MYC;NeuNT tumors, and an estimator of significance comparing G3 with G1/G2 tumors, P < 0.0001.

