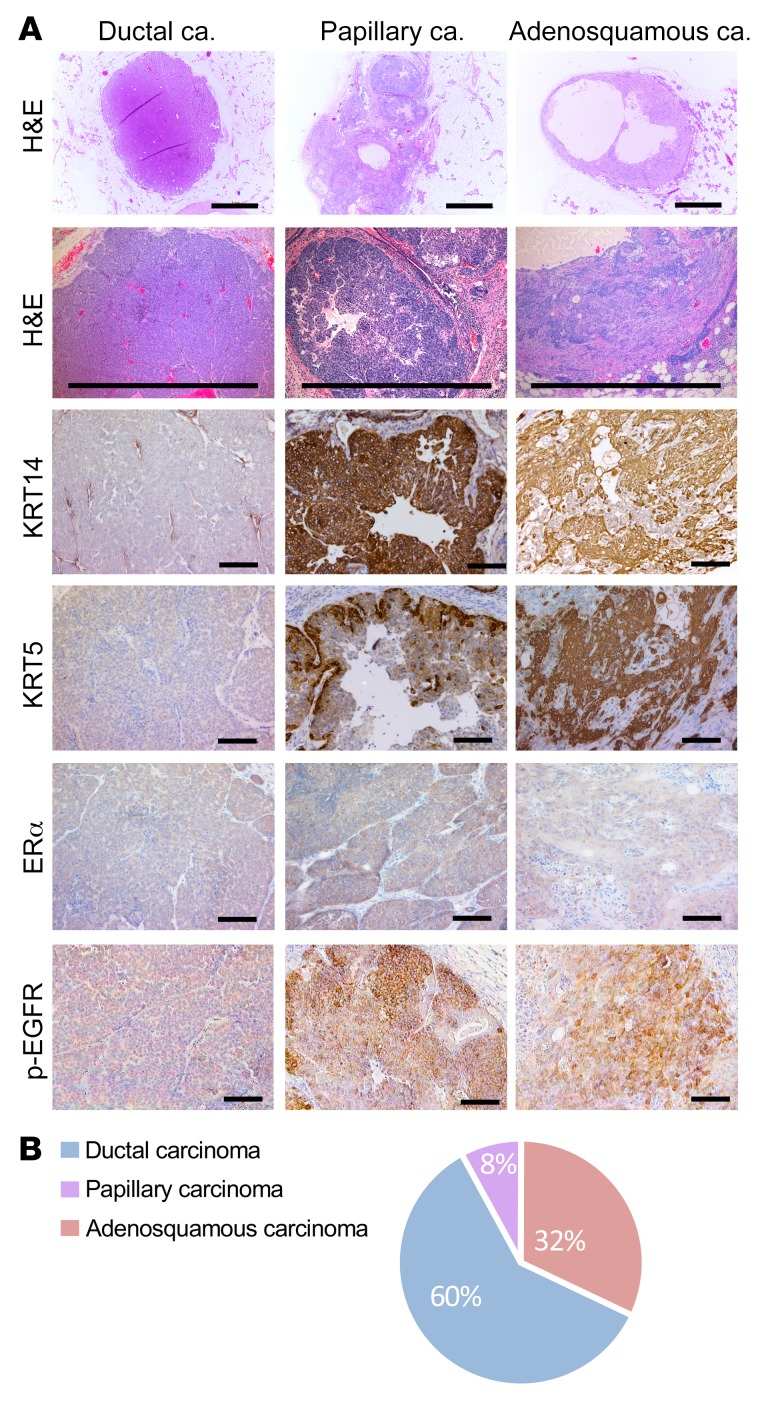
Figure 7. Small tumors recapitulate phenotypes observed in late tumors.
(A) Representative H&E images and IHC for KRT14, KRT5, ERα, and p-EGFR in small tumors (diameter < 4 mm) from MYC;NeuNT mice, n = 25. Three recurrent histologies were observed and 3 distinct patterns of KRT14, KRT5, ERα, and p-EGFR expression. Scale bars: 1 mm (H&E) and 100 μm (IHC). (B) Pie chart showing the frequency of different histologies in 25 small tumors from MYC;NeuNT mice. See Table 4 for data set summary.

