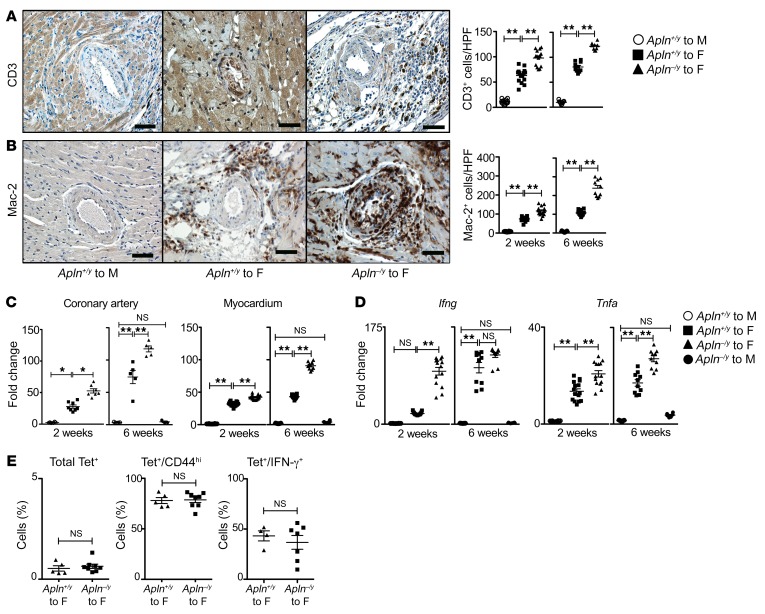
Figure 4. Apelin loss increases heart inflammation after transplantation.
Hearts were recovered after transplantation. (A and B) Immunostains for CD3, a lymphocyte marker (left panel), with quantitation at 2 weeks and 6 weeks after transplantation among grafts as in Figure 1 (A); and for Mac-2, a monocyte/macrophage marker (left panel), with quantitation at 2 weeks and 6 weeks after transplantation among grafts as in Figure 1 (B). Mean ± SEM; **P < 0.01 by 1-way ANOVA with Bonferroni’s post hoc test. Scale bars: 50 μm. (C and D) Expression of proinflammatory cytokines among heart transplants. (C) CXCL11 expression among microdissected coronary arteries and myocardium at 2 and 6 weeks after transplantation among grafts as in Figure 1. Mean ± SEM; *P < 0.05, **P < 0.01 by 1-way ANOVA with Bonferroni’s post hoc test. (D) Myocardial cytokine expression at 2 and 6 weeks after transplantation among grafts as in Figure 1. Mean ± SEM; **P < 0.01 by 1-way ANOVA with Bonferroni’s post hoc test. (E) Recipient anti-male H-Y–alloreactive lymphocytes were isolated from the spleen at 2 weeks after transplantation, identified by staining with H-Y I-Ab tetramers, and characterized by dual staining with CD44 and intracellular IFN-γ. The data from individual mice are displayed. Mean ± SEM; P = NS by Mann-Whitney test.

