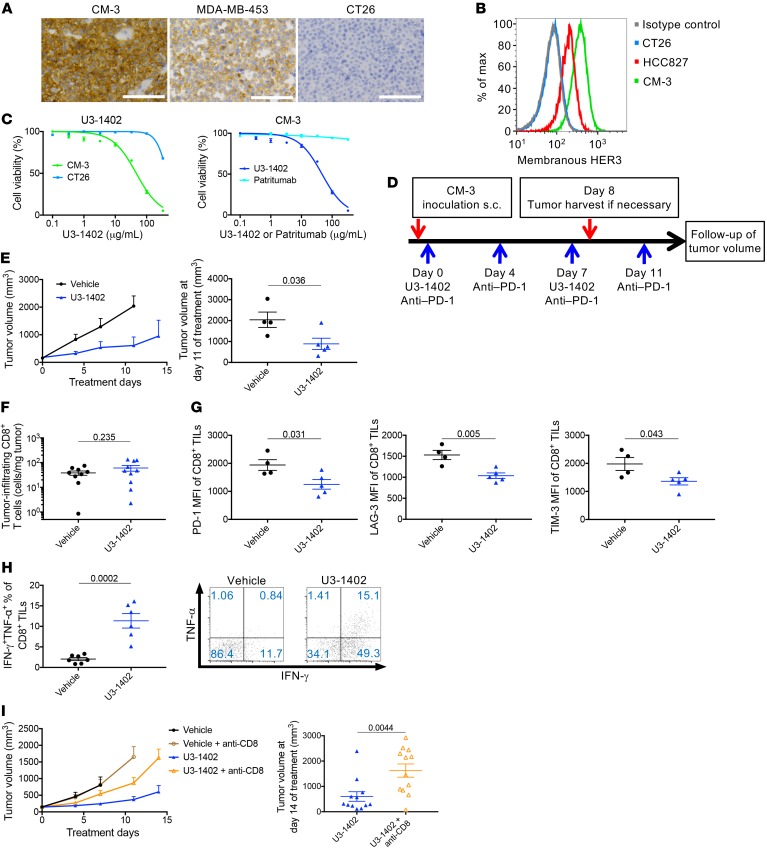
Figure 1. U3-1402 exhibits HER3-dependent cytotoxicity and improves CD8+ TILs function.
(A) Images of membranous HER3 immunostaining of CM-3 (left), MDA-MB-453 (middle), and CT26 cells (right). Scale bars: 100 mm. (B) Flow cytometry analysis of membranous HER3 expression. Data are representative of 3 independent experiments. (C) Left: in vitro growth inhibition assay for U3-1402 with CM-3 or CT26 cells. Right: in vitro growth inhibition assay for U3-1402 or patritumab with CM-3 cells. Data represent mean ± SEM of 6 replicate and 2 independent experiments. (D) Schematic of in vivo experiments. (E) Left: tumor volume curve of subcutaneous CM-3 tumors. Right: tumor volume 11 days after treatment initiation. n = 4–6 for each arm, pooled from 2 independent experiments. (F and G) Flow cytometry analysis of CD8+ TILs. n = 9–10, pooled from 2 independent experiments (F) or 4–5 (G) for each arm. (H) Left: flow cytometry analysis of IFN-γ– and TNF-α–producing CD8+ TILs. n = 6–7 for each arm. Right: representative flow cytometric plots of IFN-γ– and TNF-α–producing CD8+ TILs. Values in the figures indicate the frequency of IFN-γ– and TNF-α–producing CD8+ TILs. (I) Left: tumor volume curve of subcutaneous CM-3 tumors treated as indicated. Right: tumor volume 14 days after treatment initiation. n = 12 for each arm, pooled from 4 independent experiments. P values in E–I are shown on the horizontal lines. Each dot in E–I represents 1 tumor. Data were assessed by unpaired t tests.

