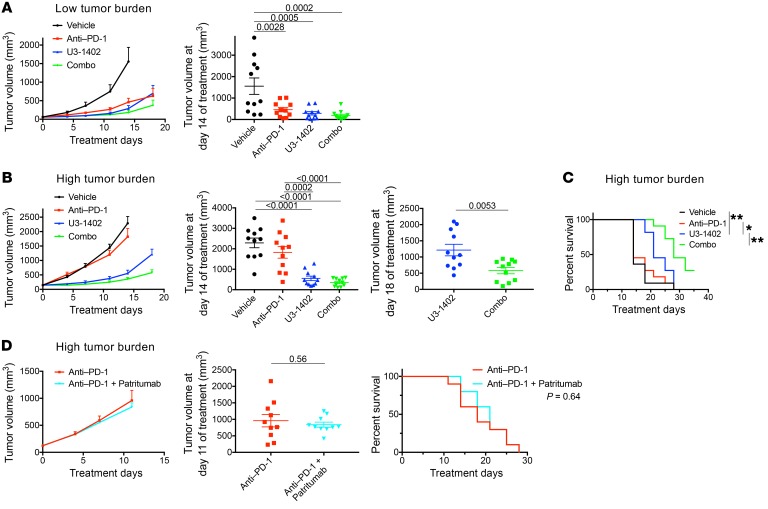
Figure 2. U3-1402 sensitizes HER3-expressing tumors to PD-1–blockade therapy.
(A) Left: tumor volume curve of subcutaneous CM-3 tumors treated as indicated. Right: tumor volume 14 days after treatment initiation. n = 11 for each arm, pooled from 4 independent experiments. Treatment was initiated when tumor sizes reached 40–80 mm3 (low tumor burden) (B) Left: tumor volume curve of subcutaneous CM-3 tumors treated as indicated. Middle and right: tumor volume at 14 days (middle) or 18 days (right) after treatment initiation. Treatment was initiated when tumor sizes reached 80–250 mm3 (high tumor burden). (C) Survival curve of CM-3 tumor–carrying mice shown in B. * P < 0.05; **P < 0.01, respectively. (D) Left: tumor volume curve of subcutaneous CM-3 tumors treated as indicated. Middle: tumor volume at 11 days after treatment initiation. P values are shown on horizontal lines. Right: survival curve for mice treated as indicated. n = 10 for each arm. Treatment was initiated when tumor size reached 80–250 mm3 (high tumor burden). P values in A and B are shown on horizontal lines only when they were less than 0.05 in multiple comparisons. Each dot in A, B, and D represents 1 tumor. Data were assessed by unpaired t test (B and D) or 1-way ANOVA with Tukey’s correction for multiple comparisons (A and B). Differences in survival curves were assessed using a log-rank test (C and D).

