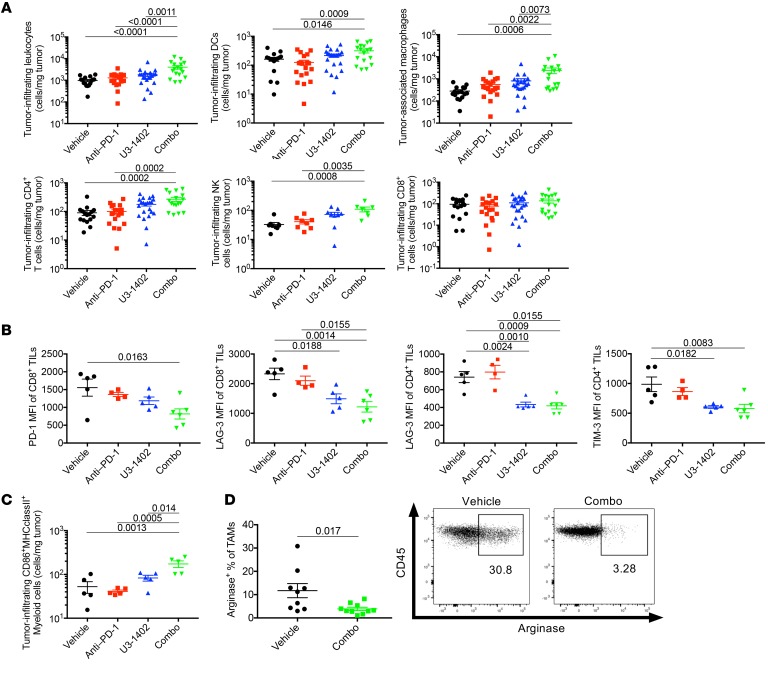
Figure 3. U3-1402 induces innate and adaptive immune cell infiltration and activation, which is enhanced by PD-1 inhibitor therapy.
(A) Flow cytometry analysis of the indicated cell types. Each dot represents 1 tumor. n = 16–22 for each arm, pooled from 5 independent experiments (for NK [middle of bottom], n = 7–9 for each arm, pooled from 2 independent experiments). P values are shown on horizontal lines only when they were less than 0.05 in multiple comparisons. (B and C) Flow cytometry analysis of the indicated cell types. Each dot represents 1 tumor. n = 4–6 for each arm. P values are shown on horizontal lines only when they were less than 0.05 in multiple comparisons. (D) Left: Representative flow cytometric plots of arginase-producing TAMs. Each dot represents 1 tumor. n = 9–10 for each arm, pooled from 2 independent experiments. P values are shown on horizontal lines. Right: flow cytometry representing arginase-producing TAMs. Each value in the figures indicates the frequency of arginase-producing TAMs. Data were assessed by unpaired t test (D) or 1-way ANOVA with Tukey’s correction for multiple comparisons (A–C).

