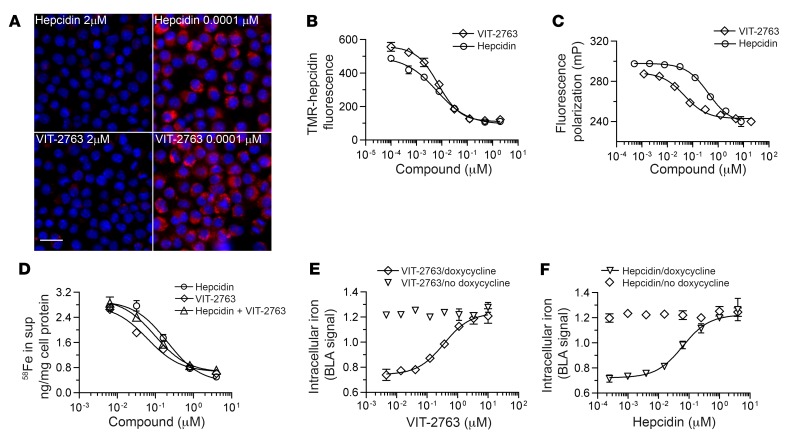
Figure 2. VIT-2763 competes with hepcidin for ferroportin binding.
(A) VIT-2763 prevented the internalization of TMR-hepcidin in J774 cells. Representative fluorescence microscopy pictures from more than 10 independent experiments are shown with J774 cells at high (2 μM) and low concentrations (0.0001 μM) of VIT-2763 or hepcidin before adding TMR-hepcidin (red). Nuclei are shown in blue. Scale bar: 25 μm. (B) Dose-response curves of VIT-2763 and unlabeled hepcidin in J774 TMR-hepcidin internalization assay. n = 3 per concentration. (C) Dose-response curves of VIT-2763 and unlabeled hepcidin in fluorescence polarization assay. n = 3 per concentration. (D) Dose-response curves in iron efflux assay in T47D cells. Shown are dose-response curves of VIT-2763 or hepcidin alone and both in a combination with equimolar concentrations. n = 3 or 4 per concentration. (E and F) Dose-response curves of VIT-2763 (E) and hepcidin (F) in HEK-FPN1-GFP ferritin-BLA reporter assay with or without doxycycline induction of ferroportin. n = 4 per concentration. Data are presented as mean + SD for each concentration.

