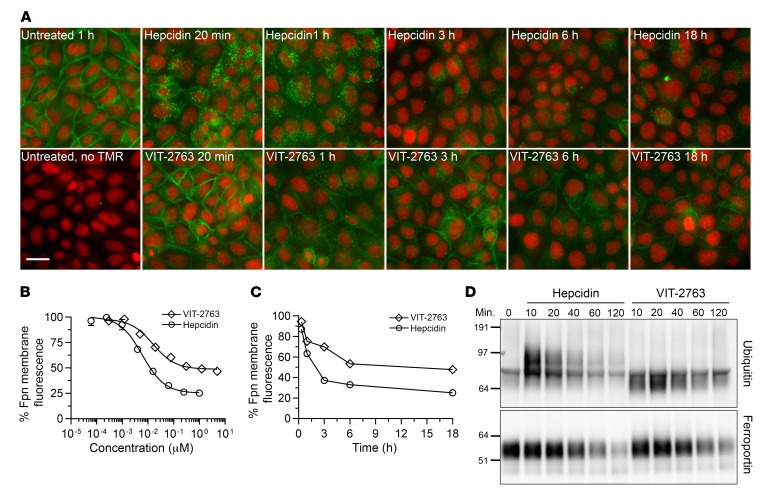
Figure 3. VIT-2763 and hepcidin induce ferroportin internalization and ubiquitination.
(A) Representative images from fluorescence microscopy kinetic analysis of ferroportin internalization and degradation in MDCK cells constitutively expressing human ferroportin with a fluorescent HaloTag (green). Nuclei are depicted in red. Cells were incubated with either VIT-2763 (20 μM) or hepcidin (1 μM) for the indicated times. Scale bar: 25 μm. The full kinetic study shown in the figure was performed once. The experiment was repeated at individual time points: once at 6 hours, 3 times at 20 minutes and 1 hour, and more than 10 times at 3 hours and 18 hours with reproducible results. (B) Quantification of the ferroportin-associated membrane fluorescence in MDCK cells treated with serial dilutions of either hepcidin or VIT-2763 for 18 hours. n = 3 per concentration. Data are shown as mean ± SD for each concentration. (C) Kinetics of internalization of ferroportin, as depicted by decrease of membrane-associated ferroportin fluorescence in MDCK cells treated with either hepcidin (1 μM) or VIT-2763 (20 μM). n = 2 (1–6 hours); n = 3 (18 hours). Mean for each time point is shown. Data in B and C are presented as mean of the percentage of ferroportin membrane fluorescence relative to untreated cells. (D) Immunoprecipitation of J774 lysates for ubiquitination and degradation studies of ferroportin. J774 cells were treated with hepcidin (150 nM) or VIT-2763 (100 nM) for 10, 20, 40, 60, or 120 minutes before harvesting and IP with MTP1 anti-ferroportin antibody. Immunoprecipitates were blotted and stained with either ubiquitin-specific (upper blot) or ferroportin-specific (lower blot) antibody (F308). The full kinetic study shown in the figure was performed once. The experiment at time points 10 and 120 minutes was performed 5 times with reproducible results.

