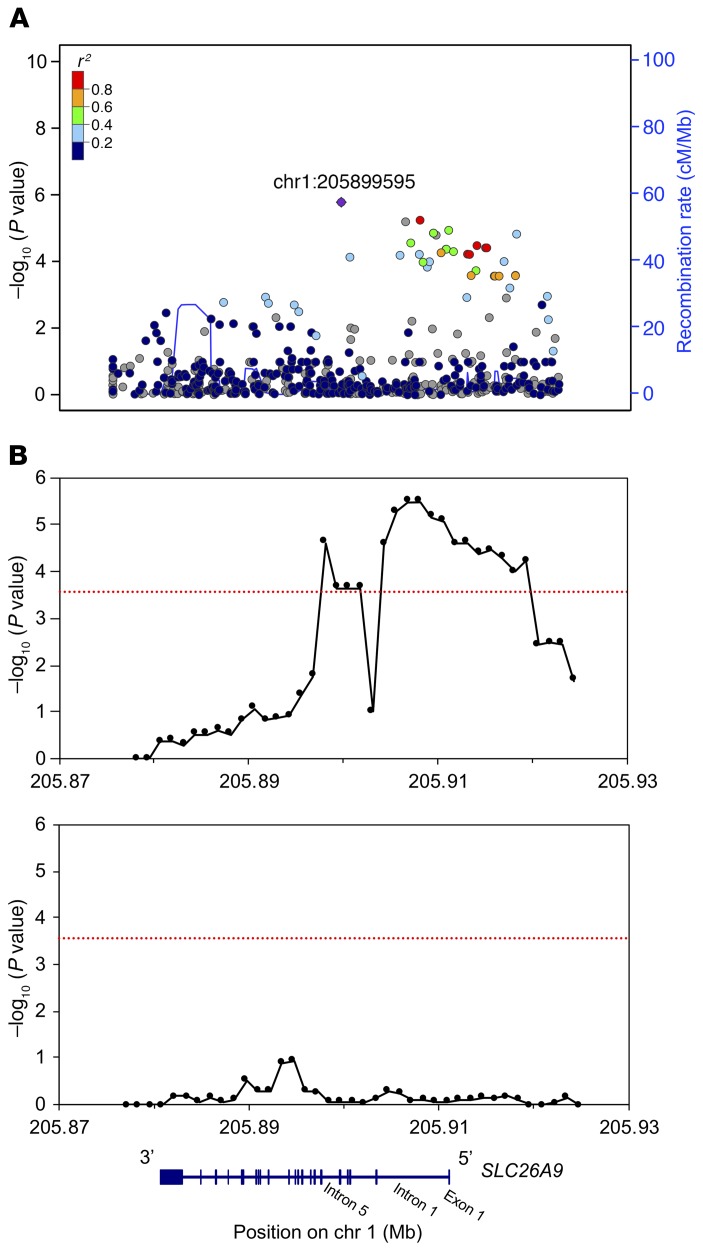
Figure 1. Association of SLC26A9 variants with age at onset of CFRD in 762 p.Phe508del (F508del) homozygous individuals.
Variants within a 47.7 kb region encompassing SLC26A9 (shown to scale at bottom) were tested. (A) Manhattan plot for association with CFRD (points, left y axis) and recombination ratio plotted by genomic location (blue line, right y axis). (B) SKAT-O test for association of sets of common (upper panel) and rare (lower panel) variants with CFRD. All variants within each 5 kb window, moved across the entire region in increments of 1250 bp, were tested for a combined association with CFRD via the SKAT-O test. The x axis denotes position on chromosome 1 (hg19), y axis shows −log10 of the regional P value. Association values were plotted at the center of each 5 kb window. Common and rare variants were assigned based on a MAF cut-off of 1%. Red line indicates significance threshold Bonferroni’s corrected for the number of sliding windows (P = 0.01/36 = 2.7 × 10⁻⁴). No other RefSeq genes are present in this region other than SLC26A9.

