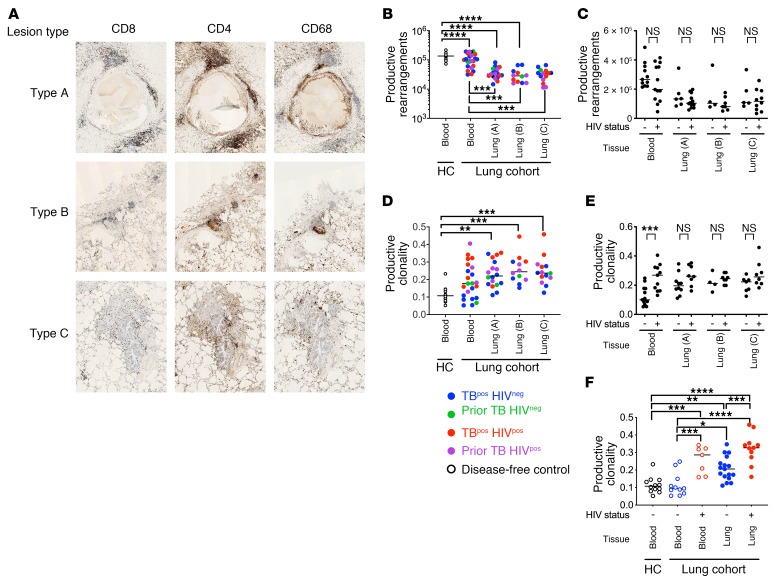
Figure 1. TCR sequences from human TB granulomas.
(A) Representative immunohistology images of lung tissue from an HIVneg subject with active TB (original magnification, ×600) showing CD4+ve and CD8+ve T cells and CD68+ve macrophages. Samples from type A tissue, the most diseased area of the resected lung, had classic caseous granulomas with a distinct lymphocyte cuff and lymphocyte aggregates. Samples from types B and C, from less diseased tissue, show lymphocytic infiltrations and uninvolved alveoli. (B) Number of unique productive TCRα and TCRδ rearrangements obtained from deep-level (blood) or survey-level (lung) sequencing. Each point represents a unique subject. Color identifies the clinical status, grouped by tissue and lung lesion type (i.e., type A, B, or C). (C) Number of unique productive rearrangements obtained from blood or lung tissue from HIVneg versus seropositive subjects (HIVpos) with active or prior TB. (D) Clonality of the productive TCRα and TCRδ rearrangements (as in B). (E) Productive clonality calculated for TCRs identified in blood or lung from HIVneg versus HIVpos subjects with active or prior TB. (F) Effect of HIV status on TCR clonality during active TB. Error bars indicate the median. *P < 0.05, **P < 0.01, ***P < 0.001, and ****P < 0.0001, by Kruskal-Wallis 1-way ANOVA with Dunn’s multiple comparisons test (B–F).

