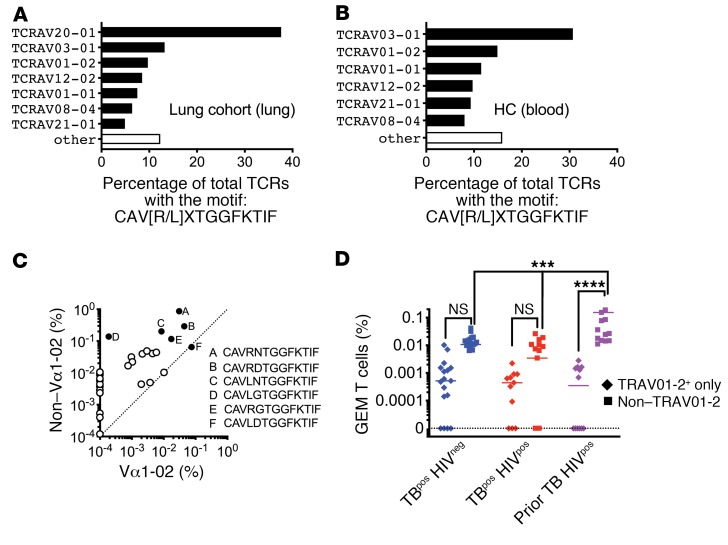
Figure 4. CD1-restricted T cells in blood and lung during active TB.
(A) TRAV diversity among TCRs from the lung cohort (blood, lung, sputum) with a consensus sequence of CAV(R/L)xTGGFKTIF. (B) TRAV diversity among TCRs from HC blood with a consensus sequence of CAV(R/L)xTGGFKTIF. (C) Relative abundance of CAV(R/L)xTGGFKTIF among TRAV01-2 and non–TRAV01-2 cell populations. Each circle represents a unique clonotype (solid circles represent the 6 most abundant clonotypes). (D) Frequency of GEM and GEM-like TCRs in lung tissue from 3 clinical populations. Some statistical comparisons have been omitted for clarity. ***P < 0.001 and ****P < 0.0001, by ordinary 2-way ANOVA with Tukey’s multiple comparisons test. Error bars indicate the median.

