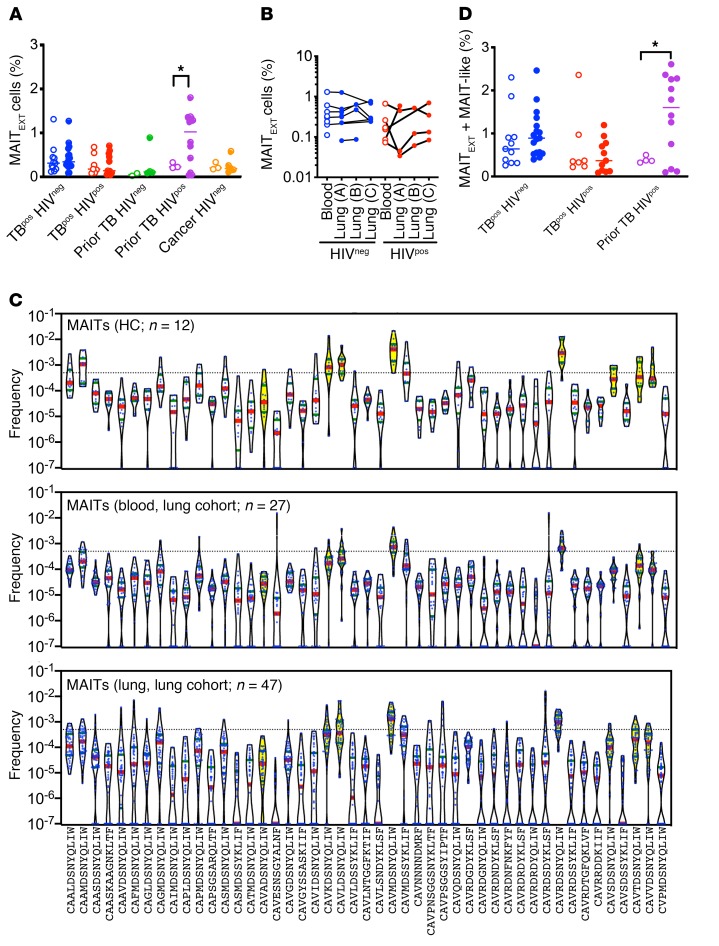
Figure 5. MAITs are expanded in the lungs of HIVpos subjects with a history of TB.
(A) Frequency of extended MAITs (MAITExt, Table 2) in blood (open circles) and lung (solid circles) among 5 clinical populations. (B) Frequency of MAITExt in paired lung and blood from subjects with active TB, stratified by HIV status. Each line represents a single individual. (C) MAITExt and MAIT-like clonotypes in HC blood (top graph) and in samples form the lung cohort (blood, middle graph; lung, bottom graph). For clonotypes not detected, a frequency of 0.0000001 was assigned. Dotted line indicates a productive frequency of 0.05%. MAITExt clonotypes are designated by violins in yellow. Red bars in indicate the median; blue bars indicate quartiles. (D) Frequency of total MAIT TCRs (MAITExt + MAIT-like) in blood (open circles) and lung (solid circles) among 5 clinical populations. *P < 0.05, by 2-way ANOVA with Sidak’s multiple comparisons test (A and D). Error bars indicate the median.

