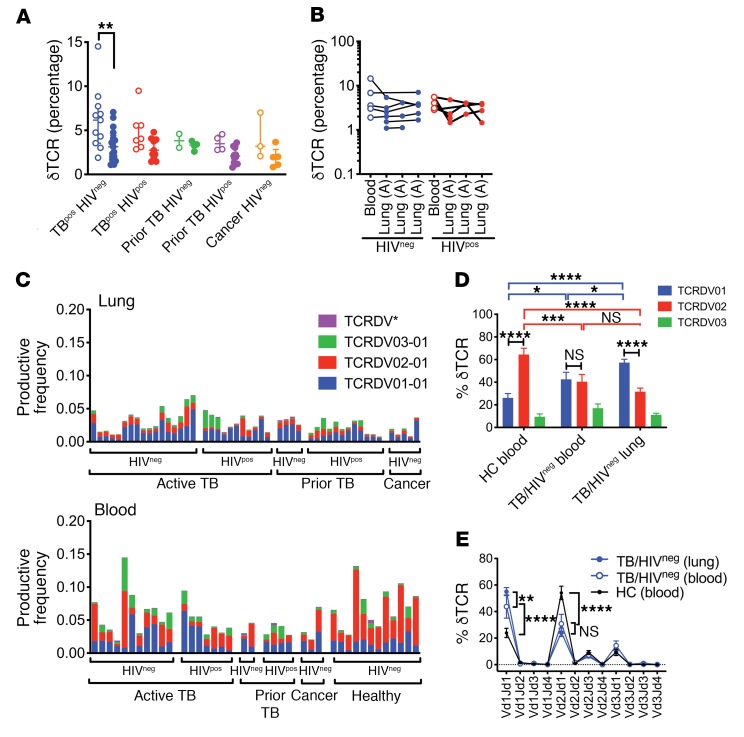
Figure 6. Distribution of unique TCRδ clonotypes.
(A) Frequency of γδ T cells (Table 2) in blood (open circles) and lung (solid circles) among 5 clinical populations. (B) Frequency of γδ T cells in paired lung and blood samples from subjects with active TB were stratified by HIV status. Each line represents a single individual. (C) Vδ1, Vδ2, Vδ3, or Vδ* (Vδ4+Vδ5+Vδ6+Vδ7+Vδ8) use for each lung (top graph) or blood (bottom graph) sample. The clinical status of each subject is shown. (D) Vδ1, Vδ2, or Vδ3 use by T cells from the blood of HCs versus blood or lung tissue of HIVneg subjects with active pulmonary TB. Some statistical comparisons have been omitted for clarity. (E) Pairing analysis of Vδ1, Vδ2, or Vδ3 with Jδ1, Jδ2, Jδ3, or Jδ4 in blood from HCs compared with blood and lung tissue from HIVneg subjects with active pulmonary TB. *P < 0.05, **P < 0.01, ***P < 0.001, and ****P < 0.0001, by 2-way ANOVA with Sidak’s (A) or Tukey’s (E) multiple comparisons test. Error bars indicate the median; data represent the mean ± SEM.

