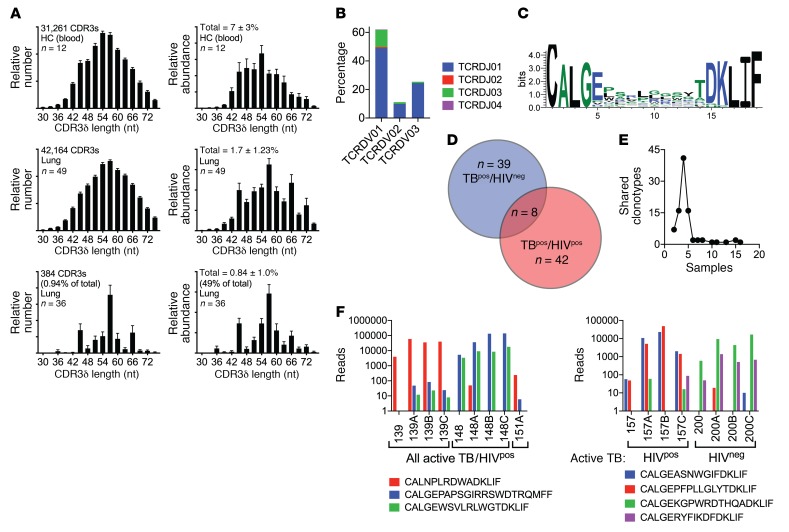
Figure 8. Enriched and abundant TCRδ clonotypes.
(A) Distribution of CDR3δ lengths based on the relative frequency (left) or abundance (right) of all unique clonotypes in blood (top row), lung (middle row), or 92 enriched and abundant clonotypes in the lung (bottom row). Data represent the mean ± SEM. (B) Pairing of Vδ1, Vδ2, or Vδ3 with Jδ1, Jδ2, Jδ3, or Jδ4 gene segments for 92 lung-enriched and abundant TCRδ clonotypes. (C) CDR3δ motif for TCRδ clonotypes with a CDR3δ length of 19 aa. (D) Distribution of the 92 TCRδ clonotypes between HIVneg or HIVpos subjects with active TB. The numbers indicate unique clonotypes. (E) Sharing of unique CDR3δ DNA rearrangements among the 88 blood and lung samples that encoded each unique clonotype. (F) Shared clonotypes between different subjects and their relative abundance. Data represent the mean ± SEM.

