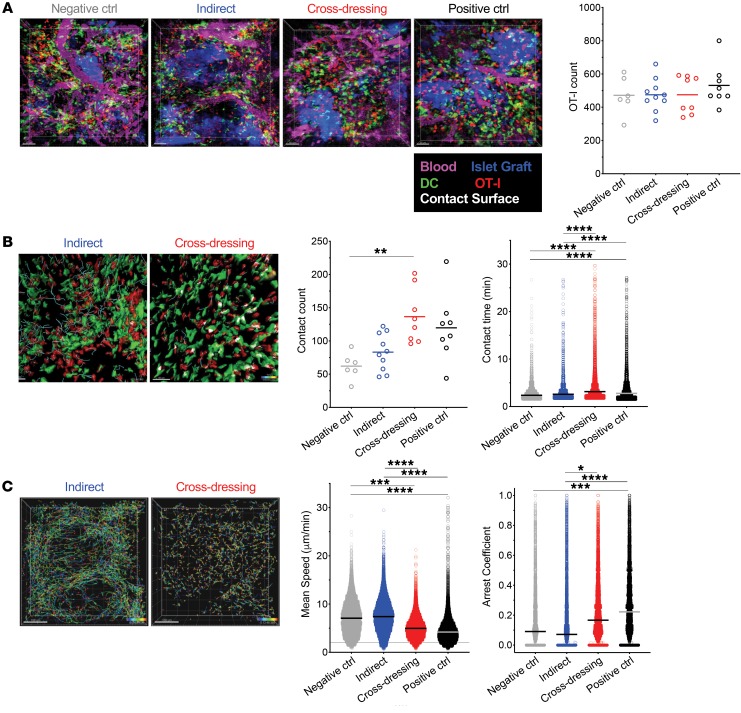
Figure 2. Cross-dressed host DCs make stable contacts with Ag-specific, CD8+ effector T cells in islet allografts.
2P-IVM was performed on islet grafts 24 hours after transferring OT-I effectors as outlined in Figure 1A. Three mice were imaged per group with multiple locations (between 2 and 6) imaged per graft. (A) Equal infiltration of allografts with OT-I effectors (red) in all groups. Allografts were well vascularized (magenta) at the time of imaging and had abundant host-derived YFP+ DCs (green) in and around islets (blue). Supplemental Video 1, corresponding to the micrographs, illustrates dynamic behavior of OT-I in the grafts. Each data point in the plot represents total OT-I counts in 1 graft location imaged. Ctrl, control. (B) OT-I paths over 5-minute imaging period (blue dragon tails) and contact with DCs (white surfaces) are shown in the photomicrographs and in Supplemental Video 2. Quantification of OT-I DC contacts per image volume and contact time are shown in the graphs. Each data point in the first plot represents total OT-I DC contacts counts in 1 graft location imaged. Each data point in the second plot represents contact time for each OT-I cell (all cells that made contact with DCs for more than 90 seconds were analyzed per location imaged; range = 259–1450 cells/location). (C) Arrest of OT-I effectors in the cross-dressing group is depicted by the shorter paths they took compared with the indirect group (photomicrographs with paths tracked over a 30-minute period) and by the quantitation of mean speed and arrest coefficients (graphs). The arrest coefficient is the proportion of time in which a cell moves less than 2 μm/min. Each data point in the plots represents a single OT-I cell (all cells were analyzed per location imaged; range = 987–2361 cells/location). *P < 0.05, **P < 0.01, ***P < 0.001, ****P < 0.0001. Random intercept model with the Bonferroni’s multiple comparison adjustment for pairwise comparisons between group means was applied to avoid pseudoreplication errors. Comparisons not shown in Figure 2, B and C, were not significant. Scale bars: 50 μm (A); 40 μm (B); 100 μm (C).

