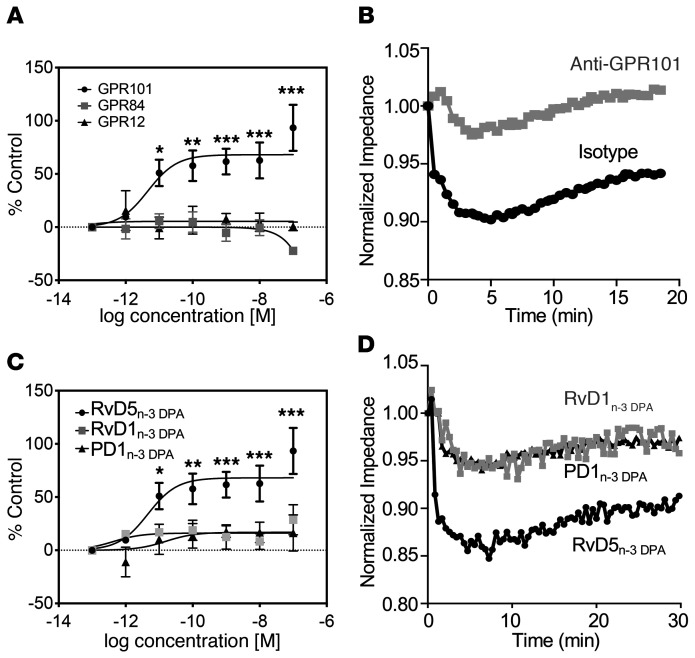
Figure 2. Activation of GPR101 by RvD5n-3 DPA.
(A) RvD5n-3 DPA was incubated at the indicated concentrations with CHO cells expressing human GPR101 (circles), GPR84 (squares), or GPR12 (triangles) coupled with the β-arrestin reporter system, and receptor activation was measured as an increase in luminescence signal. Results represent the mean ± SEM. n = 5–7 independent experiments. *P < 0.05, **P < 0.01, and ***P < 0.001 versus the respective vehicle control group; 2-way ANOVA with Tukey’s post hoc multiple comparisons test. (B) CHO cells overexpressing GPR101 were incubated with either isotype control or anti-GPR101 antibody (30 minutes at room temperature) and then with 1 nM RvD5n-3 DPA, and impedance was measured over a 20-minute period using the xCELLigence DP system. Results are representative of 3 distinct experiments. (C) CHO cells expressing GPR101 coupled with the β-arrestin reporter system were incubated with the indicated concentrations of RvD5n-3 DPA, RvD1n-3 DPA, PD1n-3 DPA, or vehicle (PBS containing 0.01% ethanol), and receptor activation was measured as an increase in luminescence signal. Note that the same data is shown for the RvD5n-3 DPA trace as the GPR101 trace in A. Results represent the mean ± SEM. n = 5–7 independent experiments. *P < 0.05, **P < 0.01, and ***P < 0.001 versus the vehicle control group; 2-way ANOVA with Tukey’s post hoc multiple comparisons test. (D) RvD5n-3 DPA, RvD1n-3 DPA, and PD1n-3 DPA (10 nM) were incubated with GPR101-expressing CHO cells, and impedance was measured over a 30-minute period using the xCELLigence DP system. Results are representative of 3 distinct experiments.

