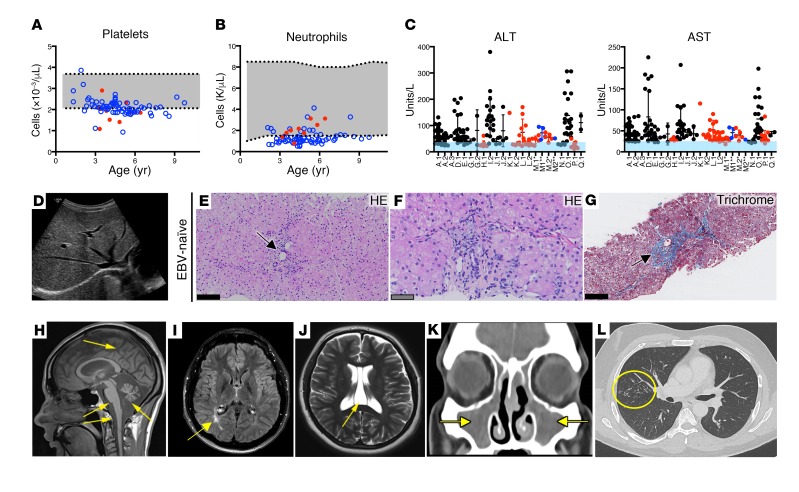
Figure 2. Multisystem abnormalities in XMEN disease.
Platelet (A) and absolute neutrophil (B) counts for an EBV-naive (red) patient and an EBV-positive (blue) patient with a normal range (gray) and patients’ age. (C) ALT and AST levels in EBV-naive (black), EBV-infected (red), and EBV-naive patients who became EBV infected (blue) with a normal range (light blue) and patients’ identities (shown on the x axis). (D) Increased hepatic echogenicity in liver ultrasound from an EBV-naive patient. (E and F) H&E-stained (HE) liver biopsy from an EBV-naive patient showing mild focal portal chronic inflammatory infiltrates (black arrow) without interface hepatitis and hepatocytes with pale cytoplasm. (G) Masson’s trichrome–stained image of liver biopsy sample from the same EBV-naive patient shows periportal fibrosis (black arrow). (H) T1-weighted MRI demonstrating severe diffuse atrophy of the cerebrum, cerebellum, brainstem, and spinal cord (yellow arrows). (I) T2 fluid-attenuated inversion recovery (FLAIR) brain MRI showing occipital leukomalacia (yellow arrow). (J) T2-weighted brain MRI demonstrating CSP (yellow arrow). (K) CT scan of paranasal sinuses showing opacification of the maxillary sinuses (yellow arrows) in a patient with bacterial sinusitis. (L) CT scan showing extensive tree-in-bud nodular infiltrates in the right lung (yellow circle) in a patient with longstanding hypogammaglobulinemia. (E–G) Scale bars: 50 μm (gray) and 100 μm (black).

