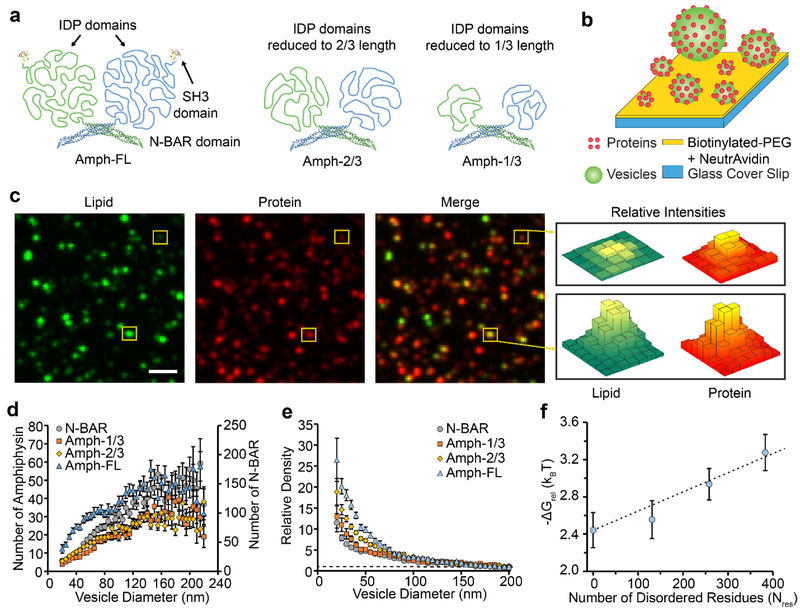
Figure 1: Amphiphysin1 curvature sensitivity decreases as the disordered domains are truncated.
(a) Structure of full-length Amphiphysin1 and its truncation mutants. (b) Schematic of the assay used for tethering vesicles and measuring curvature sensitivity. (c) Lipid, protein, and merged fluorescent images of vesicles exposed to 2 nM Amph-FL. Yellow boxes indicate vesicles with different fluorescence intensities, which correspond to vesicles with different diameters. (d) The average number of proteins bound to each vesicle as a function of vesicle diameter for populations of vesicles exposed to either N-BAR, Amph-1/3, Amph-2/3, or Amph-FL. (e) The relative density of Amph-FL and its truncation mutants as a function of vesicle diameter. The dashed line corresponds to Relative Density = 1. (f) ΔGrel plotted as a function of the number of residues in the IDP domain, Nres. The dashed line represents the scaling expected based on polymer theory. All vesicles were composed of 76% DOPC, 15% DOPS, 5% PI(4,5)P2, 2% Oregon Green-DHPE, and 2% DP-EG10-biotin. Scale bar in c represents 2 μm. Data in d-e is presented as a 5 nm-increment moving average of the raw data (>1000 total data points, see Supplemental Figure S2). Each error bar represents the standard error of the mean within each bin. Each of these bins contains from 15–272 data points acquired cumulatively from three independent replicates. In d-e, N-BAR and Amph-1/3 concentrations were 5 nM, while Amph-2/3 and Amph-FL concentrations were 2 nM. Concentrations were varied to ensure that all proteins occupied the vesicles at comparable membrane coverages, Supplemental Figure S2. Error bars in f represent the propagated error from the corresponding error in e.

