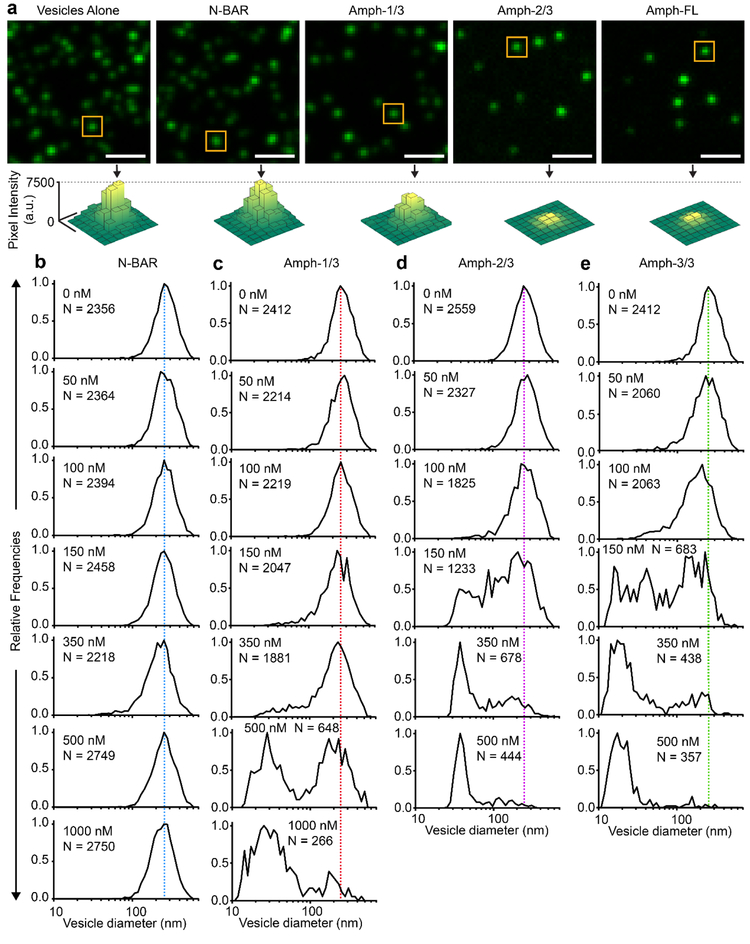
Figure 2: As the length of the disordered domain increases, membrane vesiculation becomes more potent.
(a) Representative fluorescent images of vesicles tethered in the absence of protein and after incubation with 150 nM protein. Fluorescence intensity was adjusted separately in each image to achieve maximum contrast. Images with constant fluorescence intensity scales are provided in Supplemental Figure S3. Yellow boxes highlight representative vesicles with fluorescence intensities near the population median. Surface plots represent the distribution of pixel intensity values within the yellow boxes. (b-e) Histograms representing vesicle diameter distributions before and after exposure to (b) N-BAR, (c) Amph-1/3, (d) Amph-2/3, and (e) Amph-FL at various concentrations. N corresponds to the number of vesicles processed to generate each histogram. Scale bars in a represent 2 μm.

