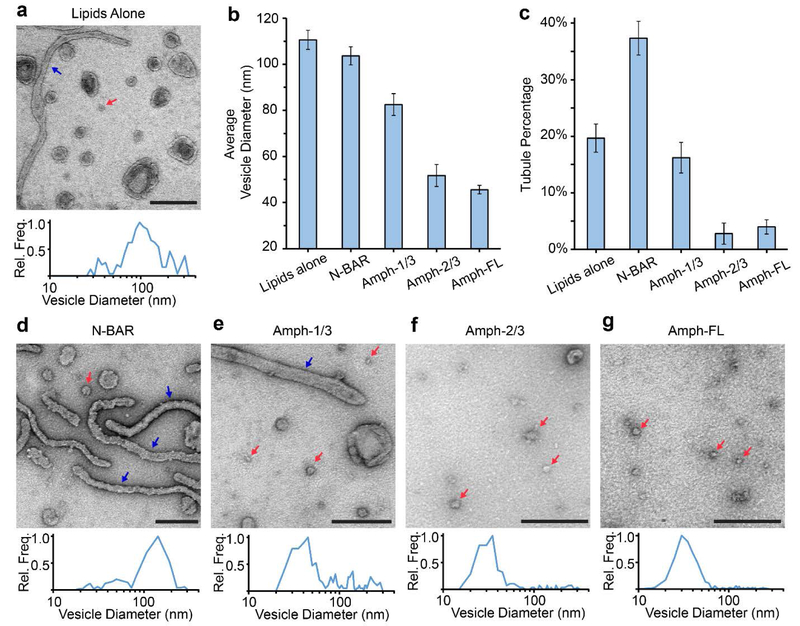
Figure 4: The disordered domain of Amphiphysin1 progressively decreased formation of lipid tubules and increased membrane vesiculation.
(a) Representative TEM image of vesicles in the absence of protein and a corresponding histogram of the measured vesicle diameter distribution. (b) Average vesicle diameters in the absence of protein and after incubation with 5 μM protein. (c) Percentage of tubules present in the absence of protein and after incubation with 5 μM protein. (d-g) Representative TEM images of vesicles and tubules after exposure to 5 μM (d) N-BAR, (e) Amph-1/3, (f) Amph-2/3, or (g) Amph-FL. Corresponding histograms of measured vesicle diameter distributions are also provided in d-g. Red arrows highlight representative vesicles with diameters that are ≤ 50 nm in diameter. Blue arrows highlight tubules. All scale bars represent 250 nm. Histograms in a, d-g contained 131–402 total vesicles. Error bars in b and c represent the standard error of the mean. In b, N = 131–402 vesicles and in c, N = 10–20 fields of view per condition. Each field of view had dimensions 1932×1932 nm2.

