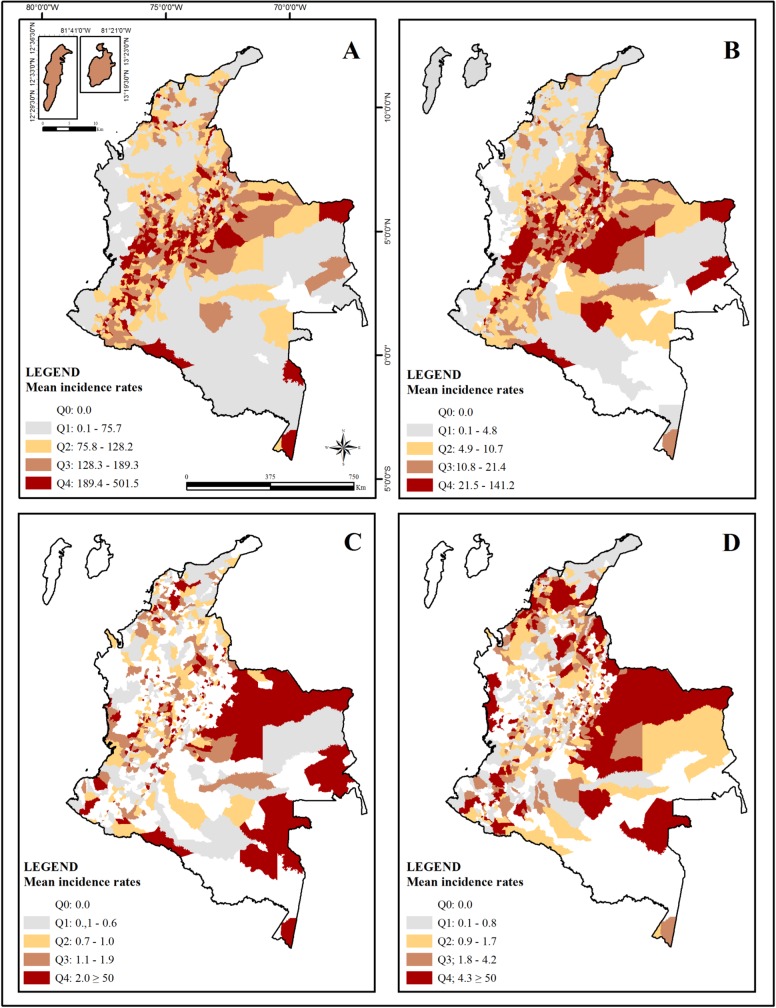
Fig 4. Spatial distribution of the mean incidence of HRE by aggressor species from 2007 to 2016 in all 1122 Colombian cities.
(A) Mean incidence rates of HRE due to dogs (B) Mean incidence rates of HRE due to cats (C) Mean incidence rates of HRE due to bats. For this map section, Q4 presents 3 cities with incidence between 50 and 1,100/100,000 habitants. (D) Mean incidence rates of HRE due to farm animals. For this map section, Q4 presents 10 cities with incidence between 50 and 142.8/100,000 habitants. Incidence levels according to quartiles (Q): Q0—No incidence; Q1—Low incidence; Q2—Moderate incidence; Q3—High incidence and Q4—Very high incidence.

