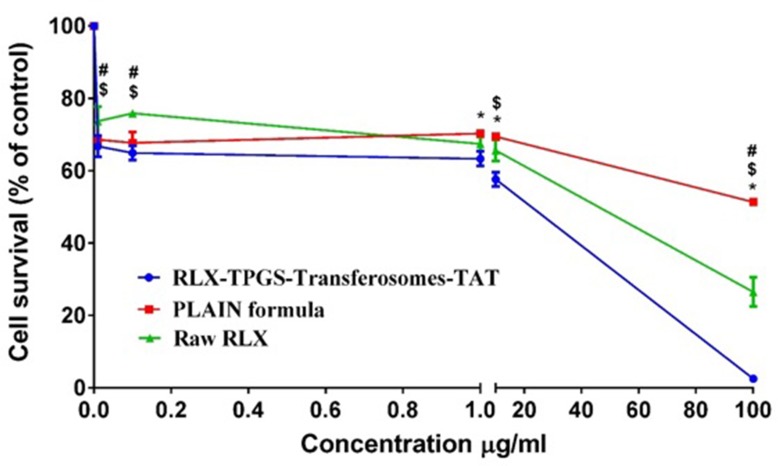
Fig 6. IC50% of RLX-TPGS-transferosomes-TAT, plain TPGS-transferosomes-TAT formula and raw RLX.
Notes: Value indicate the mean ± SD (n = 6). * p < 0.05 RLX-TPGS-transferosomes-TAT compared to plain TPGS-transferosomes-TAT formula; $ p < 0.05 RLX-TPGS-transferosomes-TAT compared to raw RLX; # p < 0.05 plain TPGS-transferosomes-TAT formula compared to raw RLX.

