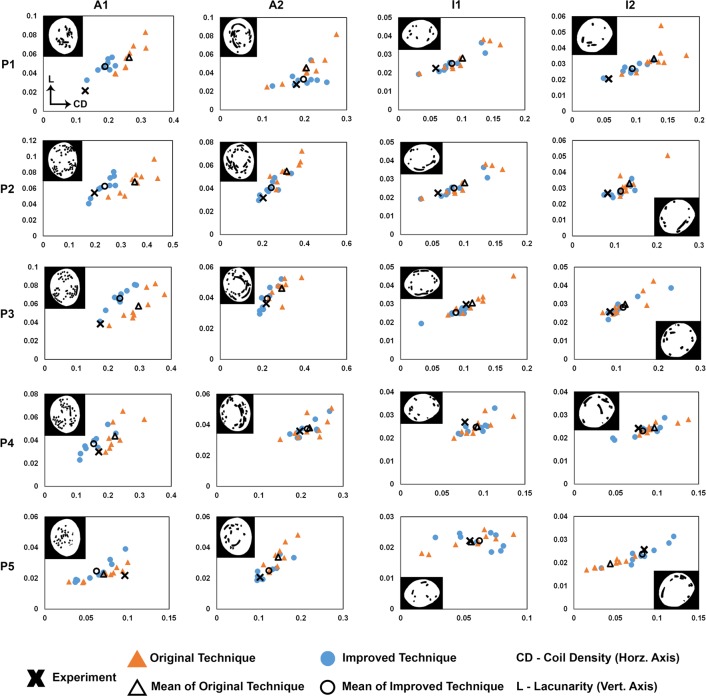
Fig 6. Quantification of coil experimental and computational results on cross-sections in aneurysm Phantoms A1, A2, I1, and I2.
The binarized image of each experimental cross-section is shown in its corresponding graph. Graphs labeled P1-P5 show the raw values for lacunarity (L—vertical axis) vs. coil density (CD—horizontal axis) measured on each phantom cross-section (1–5), whereby experimental points are shown by a cross, and individual virtual coil deployments are represented by circles (Original) or triangles (Improved). The mean of the virtual coiling results (9 realizations by each technique) are represented by hollow circles (Original) or hollow triangles (Improved). Note that the upper bounds of the vertical and horizontal axes of each graph differ in order to fit the data points tidily in each graph. We observed that in all cross-sections, the range of both virtual coiling techniques lies near the experiment point. Furthermore, in the majority of cross-sections, the mean of the Improved Technique was closer to the experiment than the mean of the Original Technique.

