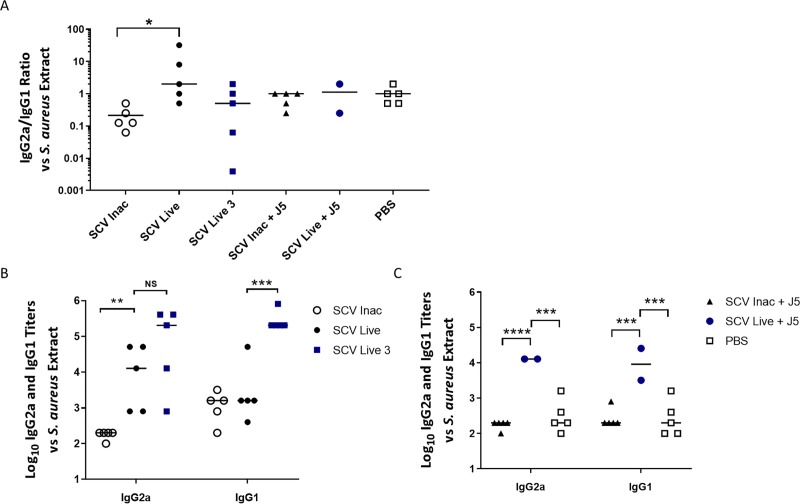
Fig 3. Th1/Th2 immune response balance of mice immunized with the live-attenuated double mutant SCV (ΔvraGΔhemB) or inactivated bacteria.
The six groups of mice shown in (A), (B) and (C) are defined in the Materials and Methods section and the immunization schedule is shown in Fig 1. Specific IgG2a/IgG1 ratios (A) and IgG2a and IgG1 titers (B-C) of mice against ΔvraGΔhemB whole cell extracts. Each dot represents the IgG2a/Ig1 ratio or the immune IgG2a and IgG1 titer of one mouse. Ratios were calculated using the specific IgG2a/IgG1 titers of each mouse. Medians are represented by horizontal lines. Ratios or titers were compared between each group (A: Kruskal-Wallis test with Dunn’s multiple comparison test; *P ≤ 0.05; B-C: Two-way ANOVA and Sidak's multiple comparisons test; ****P ≤ 0.0001; ***P ≤ 0.001; **P ≤ 0.01; NS, not significant).

