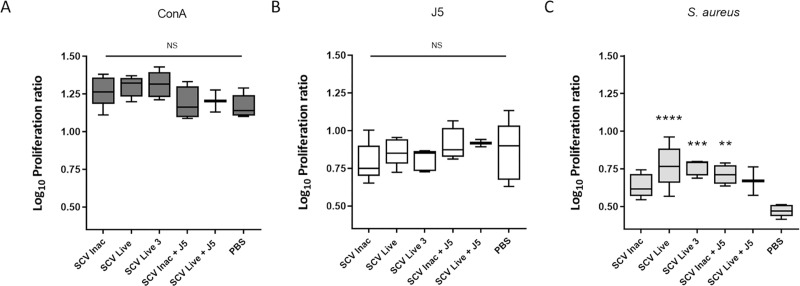
Fig 4. S. aureus-specific proliferation of splenocytes from vaccinated mice.
Cells were stimulated for 60 h with Concanavalin A (A), heat-inactivated E. coli J5 bacteria (B) or heat-inactivated S. aureus SCV ΔvraGΔhemB (C). Each box represents the interquartile distances and ranges of combined results of Log10 proliferative ratio of cells isolated from spleens of mice from one group, normalized with unstimulated cells. Horizontal lines represent the medians. Each group of immunized mice were compared to the PBS group (Two-way ANOVA and Tukey's multiple comparisons test: ****P ≤ 0.0001; ***P ≤ 0.001; **P ≤ 0.01; NS, not significant). The six groups of mice shown in (A), (B), and (C) are defined in the Materials and Methods section and the immunization schedule is shown in Fig 1.

