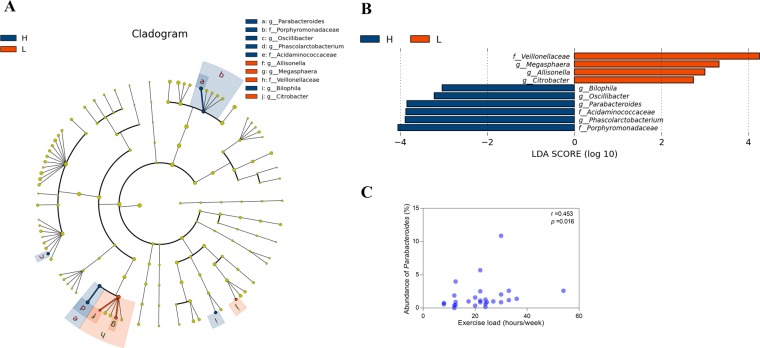
Fig 3. Taxonomic differences in the gut microbiota between the higher-level (H) and lower-level (L) groups.
(A) In the cladogram, circles radiating from the inner side to the outer side represent the taxonomic level from family to genus. Blue nodes refer to the dominant bacteria in the higher-level athletes, and the red nodes refer to the bacteria dominant in the lower-level athletes; g, genus; f, family. (B) The histogram of the LDA scores represents the taxa whose abundance showed significant differences between the higher-level and lower-level athletes. The length of each bin, namely, the LDA score, represents the effect size. LDA, linear discriminant analysis; (C) The correlation between the exercise loads per week and the abundance of Parabacteroides in the athletes.

