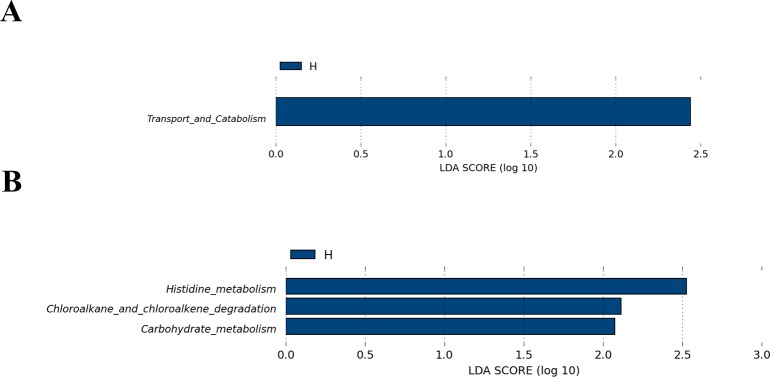
Fig 4. Functional predictions for the faecal microbiome of the higher-level (H) and the lower-level (L) groups.
(A) A comparison of the enriched markers on level 2 of the KEGG functional category between the higher-level and lower-level athletes. (B) A comparison of the enriched markers on level 3 of the KEGG functional category between the higher-level and lower-level athletes. LDA, linear discriminant analysis.

