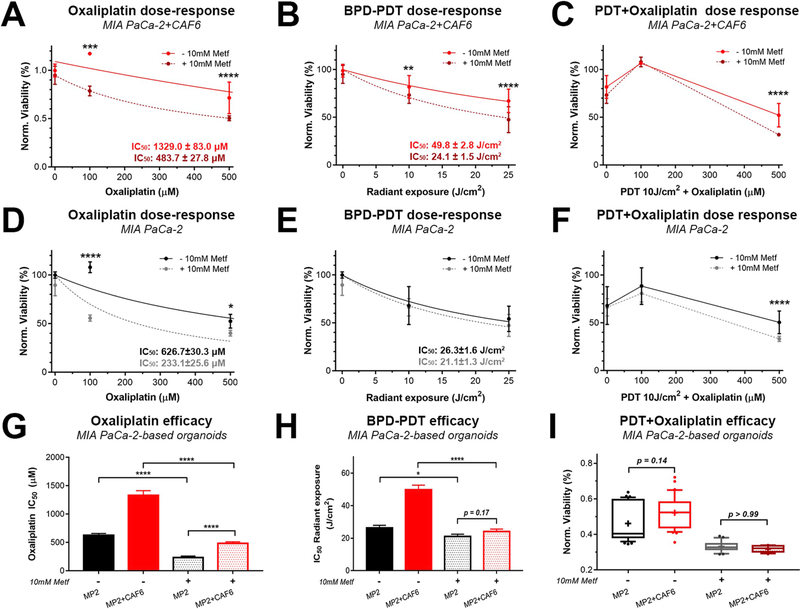
Fig. 5. Inhibition of oxidative phosphorylation with metformin overcomes CAF6-induced treatment resistance in MP2-based microtumors.
(A–C) Dose-response effects of oxaliplatin (A), BPD-PDT radiant exposures (B), and BPD-PDT + oxaliplatin combinations (C) in MP2+CAF6 microtumor cultures in presence of 10 mM Metf (dotted lines) and in absence of Metf (solid lines, similar data as depicted in Fig. 2C). (D–F) Dose-response effects of oxaliplatin (D), BPD-PDT radiant exposures (E), and BPD-PDT + oxaliplatin combinations (F) in MP2 microtumor cultures in presence of 10 mM Metf (dotted lines) and in absence of Metf (solid lines, similar data as depicted in Fig. 2C). (G–I) Comparison of oxaliplatin IC50 (G) and BPD-PDT radiant exposure IC50 (H) in microtumor cultures of MP2 only (black bars) and MP2+CAF6 microtumor cultures (red bars), as determined in the presence of 10 mM Metf (semi-opaque bars) or absence of metformin (solid bars). IC50 values were statistically compared using extra-sum-of-squares F-tests. (I) Box-whisker plots (median, average, and 90% CI, N = 12–36) representing the viability of MP2 (black) and MP2+CAF6 (red) microtumor cultures following treatment with a combination of 10 J/cm2 BPD-PDT and 500 μM oxaliplatin, performed in the absence and presence of 10 mM Metf. Data depicts the mean ± SEM of N = 12–32 from 3 technical repeats). (For interpretation of the references to colour in this figure legend, the reader is referred to the Web version of this article.)

