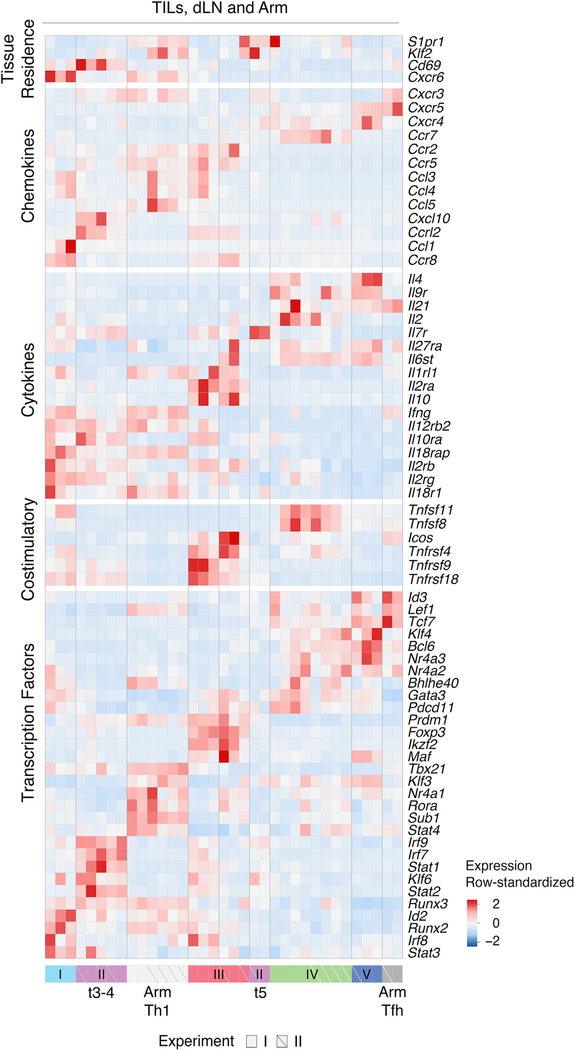
Figure 2. Transcriptomic Patterns of TILs, dLN Cells, and Arm Cells.
TILs, dLN cells, and Arm cells from replicate experiments I and II analyzed by scRNA-seq. Heatmap shows row-standardized expression of selected genes across clusters. Group II (purple) t5 separated into a distinct component from t3–4 (as defined in the text). Of note, high-level expression of T-bet and other genes in Arm cells (included in this dataset), reduces the Z score (row normalized) expression value for such genes in TILs or dLN cells, accounting for their apparent lower relative expression compared with that in Figures 1A and S2B.

