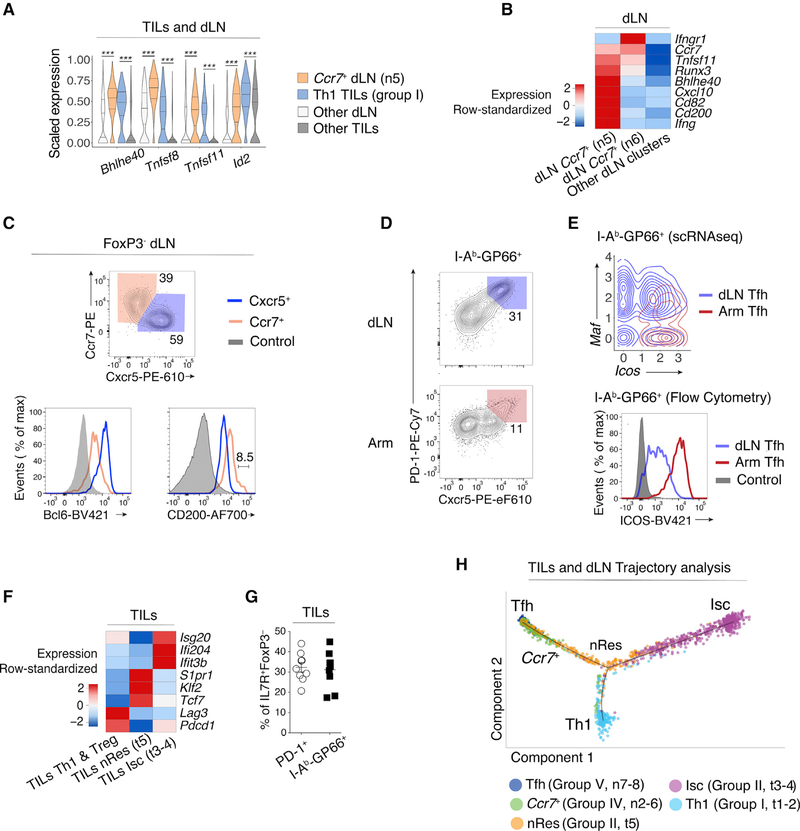
Figure 4. Transcriptomic Continuum between TIL and dLN Tumor-Reactive Cells.
(A) Violin plots of differentially expressed genes across TIL group I Th1 and dLN group IV Ccr7+ (clusters t1–2 and n5, respectively, as shown in Figure 1A), as well as all other TIL and dLN populations. Unpaired t-test; ***p < 0.001.
(B) Heatmap shows row-standardized expression of differentially expressed genes across dLN Ccr7+ clusters (group IV n5–6) and other dLN clusters (Treg and Tfh clusters n1 and n7–8, respectively).
(C) Flow cytometry contour plots of Cxcr5 versus Ccr7 in Foxp3− dLN cells (top). Overlaid protein expression of Bcl6 and CD200 in Ccr7+ and Cxcr5+ dLN cells and naive CD4+ splenocytes from tumor-free control mice (bottom). Data are representative of 17 mice analyzed in three experiments.
(D) Flow cytometry contour plots of Cxcr5 versus PD-1 in dLN and Arm cells. Data are representative of 10 mice analyzed in two experiments.
(E) Contour plot of dLN (red, clusters n7–8) and Arm (blue) Tfh cell distribution according to scRNA-seq-detected normalized expression of Icos versus Maf (top).Overlaid protein expression of ICOS in dLN and Arm PD-1+Cxcr5+ (Tfh) cells and naive CD4+ splenocytes from tumor-free control mice (bottom).
(F) Heatmap shows row-standardized expression of differentially expressed genes across TIL Isc and nRes clusters (as defined in the text, group II t3–4 and t5,respectively) and all other TIL clusters (Th1 and Treg clusters t1–2 and t6–7, respectively).
(G) Percentage of IL7R+Foxp3− cells out of total PD-1+ or GP66+ TILs. Nine mice analyzed in two experiments.
(H) Trajectory analysis of PD-1+ TILs and GP66+ dLN cells, indicating individual cells’ assignment into a transcriptional continuum trajectory. nRes cluster (t5) is color coded orange in contrast to annotations in other figures.

