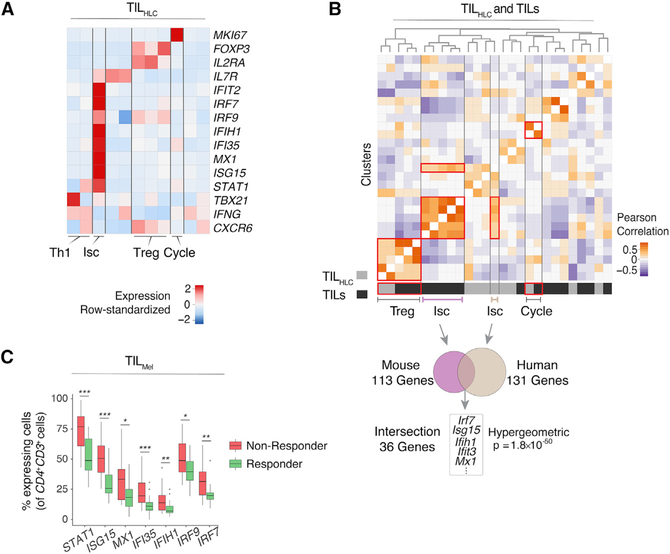
Figure 6. Correspondence to Human Data and Dysfunction Gene Signatures.
(A) Analysis of human liver cancer TILHLC. Heatmap shows row-standardized expression of selected genes across TILHLC clusters.
(B) Heatmap defines meta-clusters based on Pearson correlation between TILHLC and MC38-GP TIL clusters (top). Overlap of genes characteristic of human liver TIL Isc cluster with mouse TIL Isc gene signature (bottom).
(C) Analysis of human melanoma TILMel. Boxplots show the percentage of cells expressing selected IFN signaling-characteristic genes in CD4+CD3+ cells across responding and non-responding lesions. Unpaired Wilcoxon test; *p < 0.05, **p < 0.01, and ***p < 0.001.

