. 2019 Dec 11;8:e49630. doi: 10.7554/eLife.49630

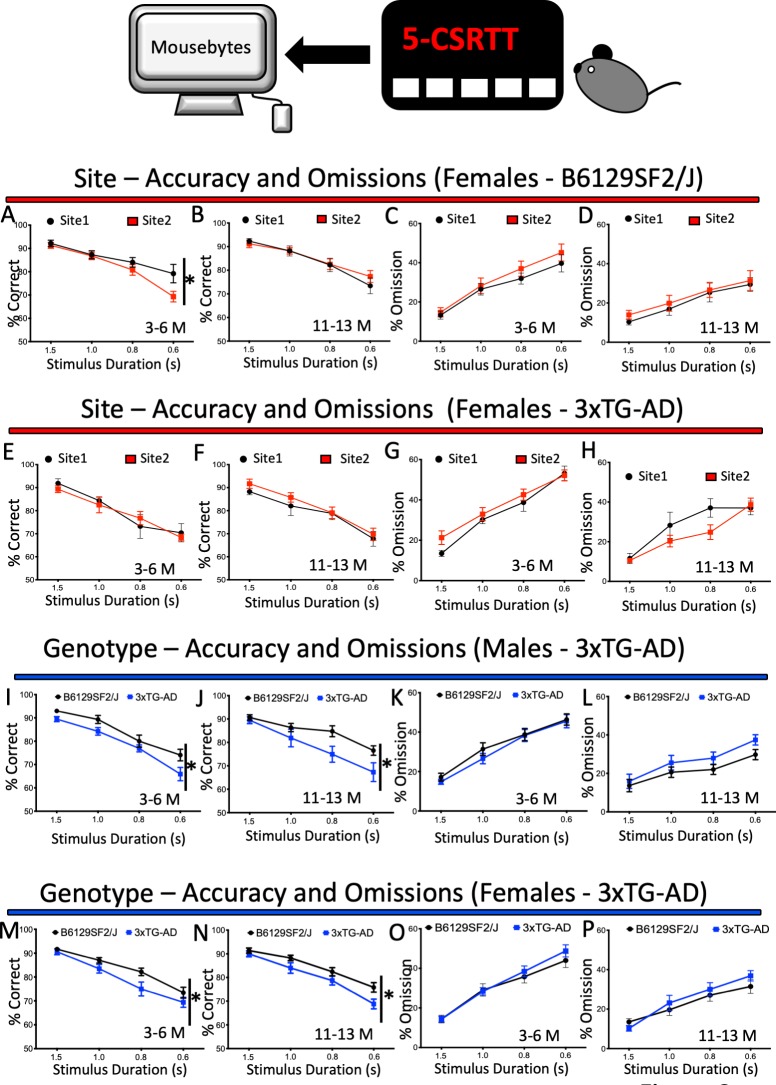
Figure 2. Performance and response measures of Male and Female mice during 5-CSRTT probe trials.

Mice were subjected to a series of probe trials and the averages of accuracy (% correct), omissions (%) and premature responses (number) were plotted at different ages. The plots were generated with data downloaded from MouseBytes and the links (datasets) for the individual analysis can be found in the results section. (A-D), longitudinal site comparison of the performance (accuracy and omissions) of female Wild-type controls (B6129SF2/J) at 3–6 and 11 to 13 months of age; (E-H) longitudinal site comparison of the performance (accuracy and omissions) of female 3xTG-AD at 3–6 and 11 to 13 months of age respectively; (I-L) comparison of the performance (accuracy and omissions) of 3xTG-AD male and their Wild-type controls (B6129SF2/J) at 3–6 and 11 to 13 months of age; (M-P) comparison of the performance (accuracy and omissions) of 3xTG-AD female mice and Wild-type controls (B6129SF2/J) at 3–6 and 11 to 13 months of age. Results are presented as means ± s.e.m.; data were analysed and compared using Repeated measure Two-Way ANOVA and Bonferroni multiple comparisons post-hoc test; *p<0.05, compared with control.

Figure 2.

Figure 2—figure supplement 1. PDEBrd1 mutation effect in the behaviour of 5xFAD mice.

Figure 2—figure supplement 1.

(A) Representative genotyping results. 5xFAD mice (red) and WT controls (blue) were genotyped as described. In the first lane, there is a positive control (+) for the 550 bp Pdebrd1 mutant allele obtained from FVB/NJ mice, followed by a WT control for the 400 bp wild-type PDEB allele (WT). Ladder (L). (B) 10 months old 5xFADPdebrd1-/- and 5xFADPdebrd1+/- evaluated in the PVD task.
Figure 2—figure supplement 2. The effect of mild caloric restriction on Aβ(1–42) levels in male and female 3xTG and 5xFAD mice at 6 months of age.
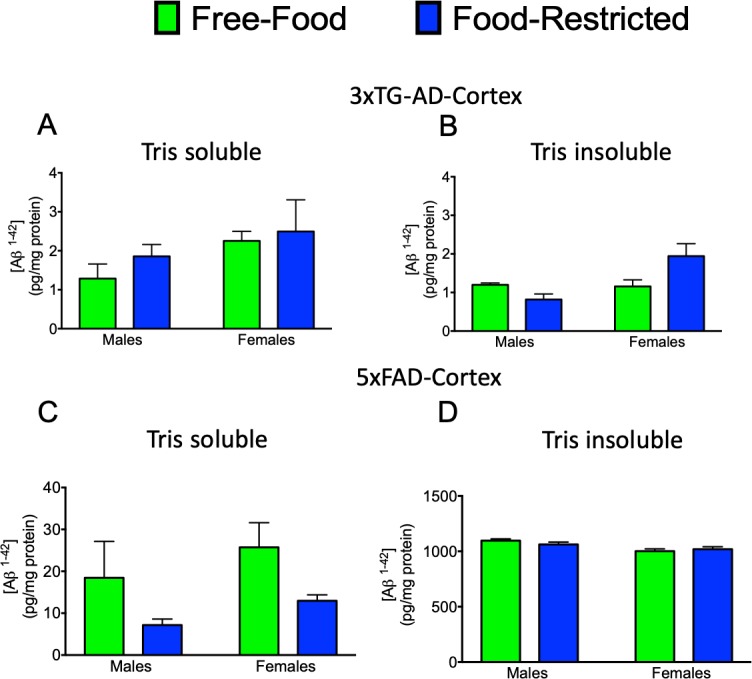
Figure 2—figure supplement 2.

(A) 3xTG Tris-soluble (p=0.921 for males and 0.999 for females); (B) 3xTG-AD Tris-insoluble (p=0.965 for males and 0.1512 for females); (C) 5xFAD Tris-soluble (p=0.163 for males and 0.367 for females); (D) 5xFAD Tris-insoluble (p=0.8271 for males and 0.991 for females);. At least three extracts obtained from each genotype/sex were analysed by Aβ(1–42) ELISA kit.
Figure 2—figure supplement 3. The effect of mild caloric restriction on amyloid pathology in male and female 5xFAD mice at 6 months of age.

Figure 2—figure supplement 3.

(A) Representative images of amyloid-beta 6E10 antibody and ToPro-3 (20x magnification; scale bar = 100 µm) and (B) quantification (mean ± SEM) of 6E10 immunoreactivity in the hippocampus (CA1) of mildly food-restricted and free food 5xFAD mice at 6 months of age (p=0.978 for males and >0.999 for females); (C) Representative images of amyloid-beta 6E10 antibody and ToPro-3 (20x magnification; scale bar = 100 µm) and (D) quantification (mean ± SEM) of 6E10 immunoreactivity in the cortices of mildly food-restricted and free food male 5xFAD mice at 6 months of age (p=0.931 for males and 0.976 for females); (E) Representative images of Thioflavin-S (Thio-S) and ToPro-3 (20x magnification; scale bar = 100 µm) and (F) quantification (mean ± SEM) of Thio-S in the hippocampus (CA1b) of mildly food-restricted and free food male 5xFAD mice at 6 months of age (p>0.999 for males and p>0.999 for females); (G) Representative images of Thioflavin-S and ToPro-3 and (H) quantification (mean ± SEM) of Thio-S in the cortices of mildly food-restricted and free food male 5xFAD mice at 6 months of age (p=0.076 for males and p=0.2993 for females). Data was compared by two-way ANOVA followed by Sidak’s multiple comparisons test. At least four samples obtained from each genotype/sex/brain region were analysed.