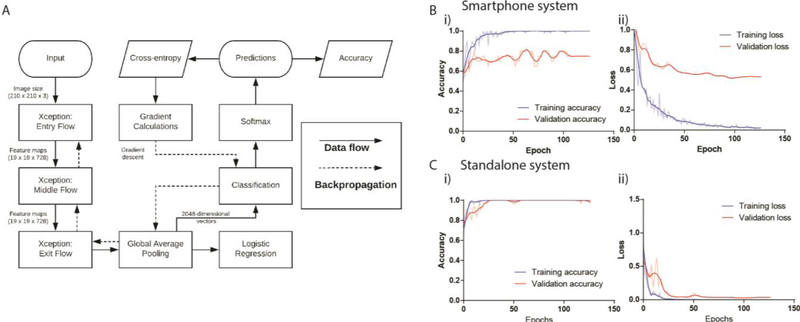
Figure 2. Graphical depiction of data flow with training and validation curves for accuracy and cross-entropy.
(A) The computational flow chart of the data through the Xception architecture. (B) The measured (i) accuracy and (i) cross-entropy loss during the training and validation phase of the network development for the smartphone imaging system. (C) The measured (i) accuracy and (ii) cross-entropy loss during the training and validation phases of the network development for the stand-alone imaging system. The bold lines indicate smoothed curves for easier visualization while the semi-transparent lines indicate their respective non-smoothened curves.

