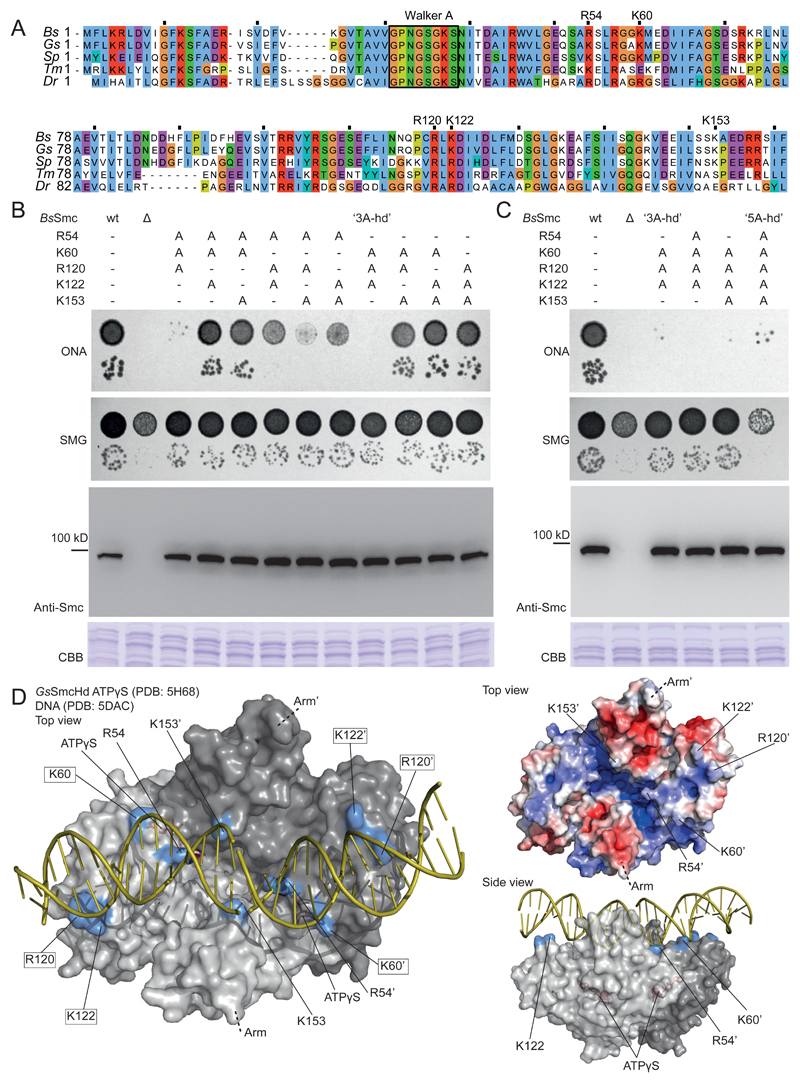
Figure 3. Identification of surface-exposed Smc head residues required for Smc function.
(A) Alignment of N-terminal sequences of five bacterial Smc proteins (Bs, Bacillus subtilis; Gs, Geobacillus stearothermophilus; Sp, Streptococcus pneumoniae; Tm, Thermotoga maritima; Dr, Deinococcus radiodurans). The conserved Walker A box motif is indicated for reference. Residues chosen for detailed analysis are denoted.
(B) Characterization of smc alleles harboring triple alanine mutations. Top panel: Colony formation by dilution (81-fold and 59,000-fold) spotting as in Figure 2D. Bottom panels: Cellular expression levels of Smc variants determined by immunoblotting with polyclonal antibodies raised against Bs Smc. CBB staining of cell extracts on separate gels is shown as control for uniform protein extraction.
(C) Smc alleles harboring selected quadruple mutations and the quintuple alanine mutation. As in (B).
(D) Surface representation of the structure of the Gs SmcHd-ATPγS complex (PDB:5H68) (in gray colors) superimposed onto Rad50Hd-ATPγS-DNA (PDB:5DAC) (only DNA is shown - in yellow colors) (Kamada et al., 2017; Seifert et al., 2016). The side chains of putative DNA binding residues are marked in blue colors. ATPγS is shown in stick representation in red colors. Residues mutated in 3A-hd are marked by boxes (left panel only). Surface-charge electrostatic potential is shown for the Gs SmcHd-ATPγS complex (PDB:5H68) (top right panel).
See also Figure S3

