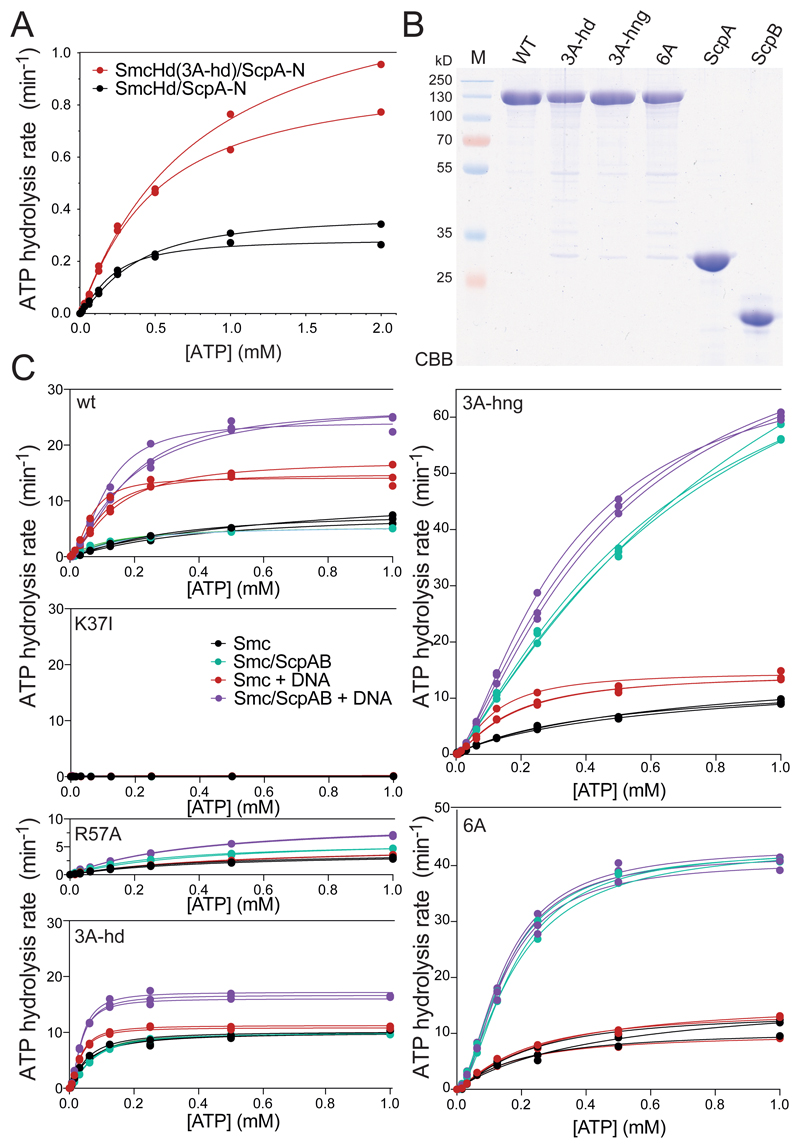
Figure 5. Rates of ATP hydrolysis by Smc heads and Smc holo-complexes.
(A) ATP hydrolysis rate of SmcHd/ScpA-N at 10 μM protein concentration and increasing concentrations of ATP as measured by an enzyme-coupled assay. The lines represent a non-linear regression fit of the Hill equation (see STAR*Methods). Data points and fits for two experiments are shown.
(B) CBB staining of purified preparations of untagged, full-length Smc, ScpA and ScpB proteins.
(C) ATP hydrolysis rates of full-length Smc proteins and holo-complexes at 0.15 μM Smc dimer concentration and equivalent concentrations of ScpB dimers and ScpA monomers. As in (A) using protein preparations shown in (B). DNA stimulation was measured by addition of 3 μM 40 bp dsDNA. Data points and fits from three experiments are displayed.
See also Figure S5, and Table S5.

